Started by the New York Times, knife-and-forked by myself, then made increasingly beautiful by graphic designers: how the view of the patents bunfight improved
In March, Nick Bilton over at the New York Times had a brilliant idea: why not do a diagram showing who's suing who in the mobile business?
So he got to work, and here is the result:

Well, there wasn't much to add to that, I thought. Until things began to hot up at the end of summer, and more patent lawsuits began to fly around. When, finally, Microsoft sued Motorola, I thought that it was finally time to update the NYT's (excellent) graphic.
So I thought that I would do a version. Now, infographics is not my best subject, so my best stab had to be drawing it using Apple's Pages. It looks confused. That's because the situation is confused. Everyone seems to be suing, or to have sued, someone else at some point. Below is the most recent version I've done, though the first appeared on this blog post on Monday.
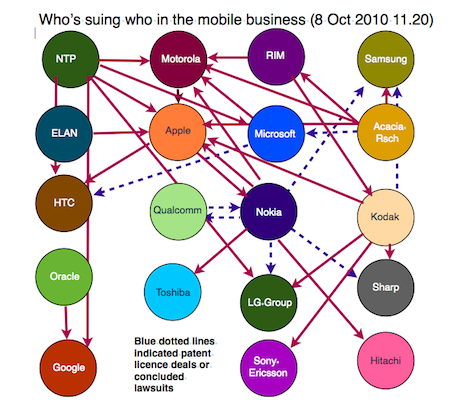
I did make a mistake in the original, since corrected: Microsoft is not suing HTC; it licensed patents to it. (This mistake is promulgated in many of the graphics. The original mistake is mine.) Also, I discovered afterwards that there are two big litigators: NTP, which is suing (deep breath) Apple, Motorola, HTC, Google, LG and Microsoft; and Acacia, which is suing Apple, RIM and Motorola, and has licensed patents to Microsoft. and after looking at Bilton's piece, and comments on the original post, it's clear Nokia's suits weren't about patents, but LCD dumping on mobile phone screens. And RIM was suing Kodak, not Sharp.)
Of course many infographics designers saw my version and wailed 'MY EYES!', and decided that Something Must Be Done. Happily, infographics designers aren't the sort to get snarky. They just do a better version.
One of the first appeared on Flickr from Paul Conigliaro, with the lawsuits split into two directions. (Personally I don't think that quite works. Your opinion may differ.)
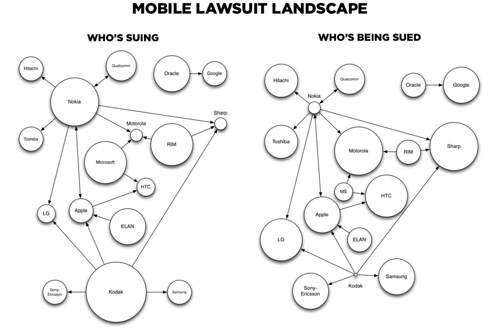
Photo by pconigs on Flickr. Some rights reserved
We also had an unknown Slashdot commenter offer a non-crossing-lines version. I preferred the colours, but, you know...

Note that the graphic has become more complicated since then with the arrival of NTP and Acacia; achieving non-crossing becomes more difficult, though not impossible of course.
Steve Webb had a stab, because 'stab' is how some people felt about my efforts:

Then the heavyweights started arriving. Of course David McAndless, of Information Is Beautiful, decided to get to grips with it. His first attempt has the advantage that it's easy to do:

But then he found his keyboard, and got handy, adding data about who exactly was suing who and why:
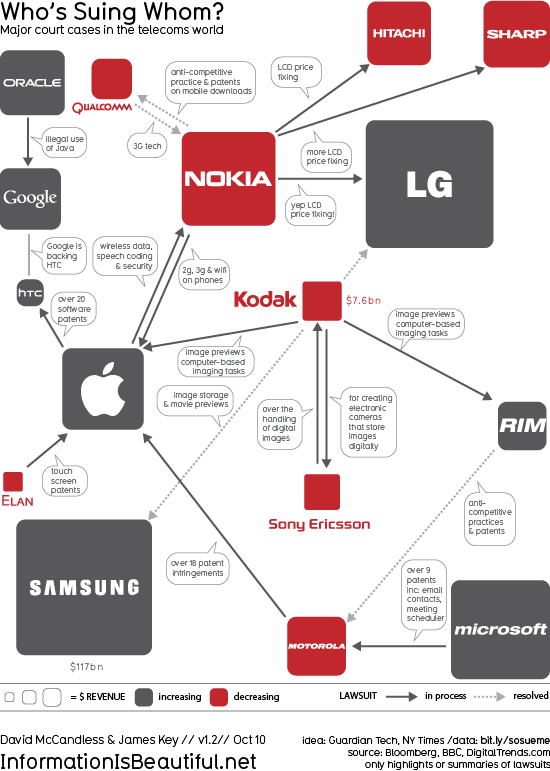
And best of all, the data comes from this open Google spreadsheet (though it's view-only, but it's a good resource to which I hope to contribute).
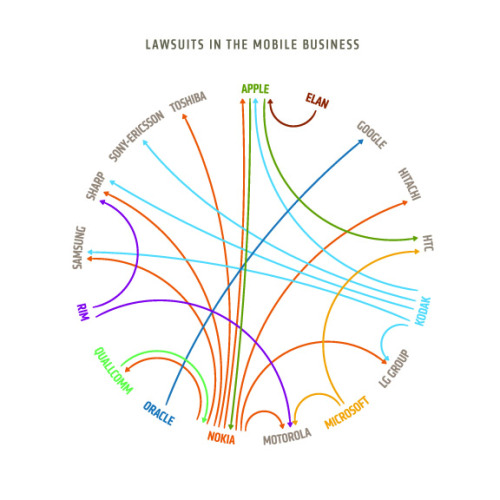
But possibly the most beautiful is that from George Kokkinidis at Design Language News (slogan: 'making visual sense of nonsense'):
I have asked what tools he used to do it, but haven't yet heard back.
If you know of any more, do tell us about them in the comments. And if you know which tools George Kokkinidis used to devise his diagram, let me know that too. I've since got an upgraded version of Omnigraffle, but I'm only at base camp on the learning curve. Update: @barwil in the comments suggests that he used Circos, and that looks correct. Plus it's a very nifty tool.
Of course, making the diagrams clearer doesn't answer the more fundamental question: are patents helping or hindering industry? Steve Ballmer of Microsoft is equivocal - he thinks they're better than nothing, but worse than they could be.
No comments:
Post a Comment