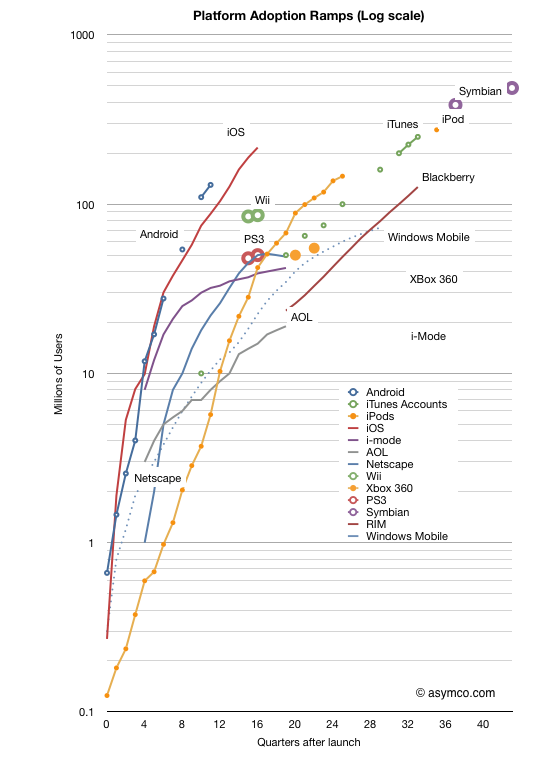
In the last two weeks we received two more data points which allow an update to the “race to a billion” platform growth trajectories. Android reached 130 million active users and iOS reached 200 million.
The updated picture looks like this:
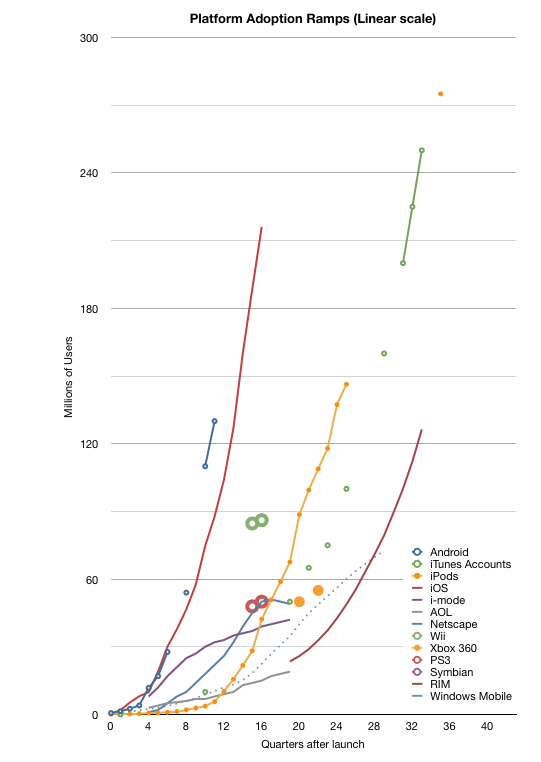
Note again that this is a log scale graph. Every major horizontal gridline is an order of magnitude (10x) larger than the one below. It’s a busy graph. The linear version follows:
For the detail-minded, it makes for some interesting comparisons, but I want to create a more compelling visualization. One where each platform can be judged for potential and impact at a glance.
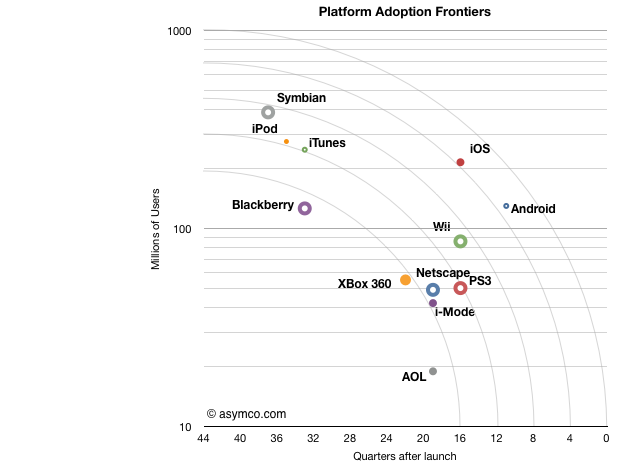
To that end I came up with something I call the platform “adoption frontier” view. Based loosely on the Pareto efficiency concept the chart is reduced to show the latest known figure of (users,time) and overlay concentric arcs centered on 10 million/10 years and radii of unit years (x-axis).
Note that the time axis is reversed from the chart above. This was to allow the best performers to be shown at the upper-right of the chart.
The way to read this is as follows:
- Each platform is represented by a point which shows its currently known peak in users and time to reach that number of users.[1]
- The arcs (frontiers) represent possible performance classes.
- The lowest frontier spans “four years to reach 10 million” to “10 years to reach 200 million”. The highest frontier spans “<1 year to reach 10 million users” to “10 years to reach 1 billion users”. Each frontier can be read in a similar way.
- The main assumption is that a platform can reach more users but it takes time. Better performance is when a platform moves toward a frontier further from the origin.[2]
- I chose the limits of the chart specifically: 10 years is roughly the limit of most platforms[3] in the current cycle time of technology disruption; One billion users is an upper bound set by Windows.
One thing you can read from the chart is to say that “from a growth point of view, Blackberry is weaker than any of the other platforms.” Sitting below the lowest frontier with fewer users than Android which has been in the market for less than a third of the time it seems to be less impressive. It is, however, in a similar band of growth as Xbox 360, which, by some measures, is a success story. So the performance standard is relative.
One can also see the rough equivalence in growth between iPod and Symbian, both having crossed the second frontier. But iOS and Android are in a different league. They sit alone beyond the fourth frontier. The fifth frontier is the “billion user in a decade” potential and it seems within reach for both.
What this view also offers is an answer to the question of competitiveness. Although platforms can co-exist and don’t necessarily overlap, the question of becoming overwhelmed with “good enough” by widespread low end alternatives looms for the specialized platforms. For example, game consoles look very vulnerable because they simply do not have the potential to cross high frontiers and orders of magnitude of casual gamers (with potential TV connected devices) might orphan the consoles.
I’ve also included some platforms that have peaked and faded (AOL and i-Mode and Netscape) as a warning. The frontiers illustrate of how hard it is to reach the upper limits of growth. Each level is exponentially more difficult than the last and achieving it with paying customers is a remarkable story of value creation.
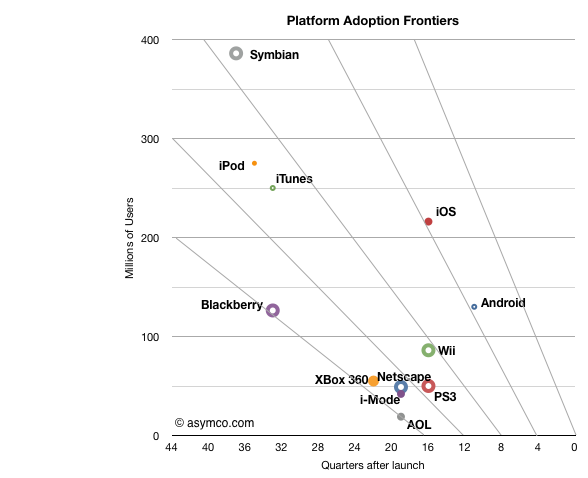
[UPDATE]
I add below the frontier chart with a linear vertical axis. Note that the frontier lines are not equivalent to the frontier arcs in terms of coverage.
—
Note:
- The data I have is for platforms where users have to pay something to participate. I exclude platforms where users are the only merchandise being sold (i.e. social networks or email provision).
- I only include the initial ramps not upgrades. Windows is anomalous because it is so old. During its first decade (1985 to 1995) it reached over 17 million users but placing it on this chart does not do it justice given the growth occurred in its second decade.
- See Symbian and Windows Mobile. However again, Windows which is nearly 30 years old, is an exception.


No comments:
Post a Comment