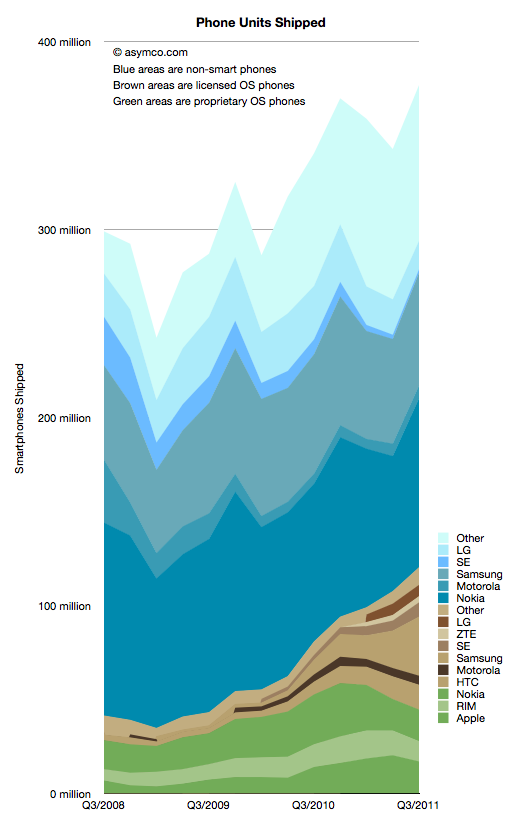
I collected all the data available so far and created a new graph that illustrates the complete market evolution over a three year period.

I chose a particular color scheme where shades of blue represent non-smart devices (think blue ocean), shades of brown are smartphones with licensed operating systems (Android for the time frame above) and shades of green as proprietary operating system smartphones. Multiple vendors are shown and those which sell both smart- and non-smart phones are shown twice. Note that the legend shows the vendors in the same order as the stacked areas.
There are several observations that are easy to make from this type of view:
- The smartphone market is growing rapidly, not surprisingly. However, the overall market is also growing. Smartphones as a percent of total units sold is at around 31%, up from 14% in Q3 2008. Smartphone units however have tripled in the same time frame (from 40 million to about 120 million). This means that almost all of the market’s growth has been smartphones with non-smart units barely increasing from 258 million to 272 million over a three year span.
- Non-smart phones are far more seasonal than smartphones. As smartphones increase in share, seasonality should match that of the other phone types.
- The number of branded smartphone vendors has increased significantly with “others” becoming a small part of the total. In contrast, the opposite effect is taking place in the non-smart market. Non-smart phone shipments have concentrated in two main brands and a large set of “others”. This bi-polar industry structure points to where the value is migrating and hence where rivalry is increasing. We can use these shifts as indicators of industry maturity.
- The opportunity for smartphone growth remains in the 70% un-penetrated blue area. However there is evidence that smartphone “switchers” are increasing with a noticeable decline in Nokia/Symbian and RIM. Apple’s decline in Q3 is likely to be reversed in Q4 but Apple’s share of all phones remains under 5%– a five-fold increase in share from 2008 but a sign of how much is left to be done.
- As Nokia shifts its Symbian portfolio to a licensed Windows Phone model the licensed cohort will tip over into an “all but two are licensees” line-up. This should be particularly worrisome as value is shifting to software and services and “super-platforms”. But before the disruption is complete, there are still some cards to play. Samsung and Nokia have vast non-smart volumes to convert and it’s unclear if they will do it with Android and Windows vs. layering their own proprietary Bada and future Nokia Linux platforms.
In the next few weeks I’ll publish details of all the measures of the market but this first “landscape” view gives a good initial perspective. In the mean-time the data is accessible from the Asymco “cloud” here.
No comments:
Post a Comment