Pages

Live blogging Feed

Thursday, August 23, 2012

International Tablet of Mystery

International Tablet of Mystery:
One of the remarkable patterns associated with the iPad has been its growth rate. Looking at the ramp of the product relative to the iPhone and iPod touch reflects this sense of raised expectations:


At the same point in time, and adjusting for seasonality the iPad is outselling the iPhone by a factor of 3 and the iPod touch by a factor of about 5. This is also reflected in the installed base of devices, where the 84 million iPads sold through its first nine quarters is more than three times the iPhone base at a similar point in time.

Of course, the world of 2012 is different than the one from 2009 when 25 million iPhone sold. iPhones are available in far more points of sale and to many more buyers world-wide. But the interesting contrast is between the iPad and the iPod touch.
I’ve always maintained that the dynamic difference between the iPad and the iPhone is that it’s unrestrained (and unsupported) by the operator channel and all that it implies. The iPad is a pure computing product whose means of communication is unregulated. That means transparency in pricing and transparency in distribution.
But so is the iPod touch.
The iPod touch is a “nano iPad” (or as detractors put it, the converse of that.) So shouldn’t the iPod touch behave as the iPad?
We don’t know exactly how the iPod touch behaves. We don’t have specific figures on its sales. What you see in the charts above are my estimates for the iPod touch based on company statements that “about/above 50%” of iPods are touch versions. That and the cumulative sales totals that are occasionally reported.
However, we have received an unexpected morsel of data from the Samsung v. Apple trial that may help characterize the two products: US sales data. Having the US data and knowing/estimating the global data gives us an estimate of the international (ex-US) sales for all three products.

I indexed the three products to measuring quarters since launch. The pattern here is that the iPad diverges from the iPod touch in its international appeal. Since the iPad expanded internationally even faster than the iPhone, the issue is not only one of rapidity in appeal but also a qualitative difference.  The iPod touch seems to have stabilized at 50% non-US sales while the iPhone is between 60% and 80% outside the US.
The iPad reached 60% non-US sales in its first year. Its last quarter was 70% outside the US.
So what’s going on?
The characteristic value of the iPad is in its appeal to “computing non-consumers”. Computing has come to mean media consumption, education, communication and entertainment. These jobs to be done are casually done with much more ease on an iPad. The iPod touch can do these jobs as well, but not as comfortably. The iPod touch is “absorbable” by younger consumers and typically they have their hiring done by their parents. Those parents are less likely to indulge where incomes are lower.
But the universal appeal of the iPad is evident in its global visibility. Like the tasks it performs, the iPad itself is becoming less of a mystery.

The Interlopers

The Interlopers:
Google, Microsoft and Apple all had reasonably good second quarters. Microsoft’s revenues grew by 4%, Google’s by about 22% and Apple by 23%. Apple’s growth was disappointing but the other companies weren’t. The revenues for the three companies are shown in the following charts:


I also showed the performance of each company’s operating income in the bottom three charts.
Microsoft did declare a one-time write-off of $6.2 billion which it spent on aQuantive a few years ago. That was booked as contributing to a loss of $6.67 billion for its Online Services division. Without that one-time charge consolidate operating income would have grown at about 3.6%. Google’s operating income grew at a rate of 11% and Apple grew (again, disappointingly) at 23.4%.
Apple’s operating margin fell to 33.1% while Google’s fell to 29.2%. Microsoft’s margin evaporated due to the one-time charge. If we back that charge out, the margin would have slightly topped 35%.

Comparing the contribution (in operating income) for each division or product line (where possible) gives the following view:

I tried to remove some noise by isolating the iPhone and iPad and consolidating Microsoft overall and Google.

By also smoothing out seasonality with a four-period moving average we can observe the pattern of growth for the iPhone and iPad relative to the other companies’ overall performance.
The crucial question remains if and when the iPad will be a bigger business than Google and/or Microsoft. The iPhone climbed over both some time ago.

Report: Social network demographics in 2012

Report: Social network demographics in 2012:
people social mashup
Do you know how old the average Twitter or Facebook user is? Do you know what share of Reddit’s users are women? We could go on and on; when it comes to social network demographics, the questions are endless. This article is going to answer those questions for you, showing you the age and gender distribution on 24 of today’s most popular social networks and online communities.
The sites included in this survey are: Facebook, Twitter, LinkedIn, Pinterest, Tumblr, Reddit, Hacker News, Slashdot, Github, Stack Overflow, Orkut, Quora, WordPress.com, Blogger, Flickr, Myspace, Tagged, Hi5, LiveJournal, Yelp, deviantART, StumbleUpon, Goodreads and Last.fm.
You may note one glaring omission: Google+. Unfortunately for us there is no data on Google+ in DoubleClick Ad Planner, the Google-owned tool we used for the demographics data. Another thing we should point out is that the demographics data used in this survey is for the United States.
With that out of the way, let’s dive into the data!

Average age distribution

If you average the age distribution across all the sites in the survey, this here below is what you end up with. You could think of it as the age distribution in the social media sphere.
social network avg age distribution
More than half of these social media users are between 25 and 44 years old.
This, however, was just an average. When looking at the individual sites in this survey, there are considerable differences.

Age distribution per site

As we just mentioned, there are big differences in the age demographics of the individual sites. You can examine all of them in the chart here below.
We’ve sorted the chart by average age (more on that farther down), “youngest” site at the top.
social network age distribution
This chart should make something very clear; social media is most definitely not just for the young. Some examples:
  • 55% of Twitter users are 35 or older.
  • 63% of Pinterest users are 35 or older.
  • 65% of Facebook users are 35 or older.
  • 79% of LinkedIn users are 35 or older.
However, as you could see in the very first chart of this article, only 2% of social media users are 65 or older (averaged between the sites in this survey).
There is also the flip side of the coin to consider; some sites have a considerable bias toward younger users. A few examples:
  • 58% of Reddit users are under 35.
  • 60% of Github users are under 35.
  • 63% of Hi5 users are under 35.
  • 69% of Hacker News users are under 35.
  • 69% of deviantART users are under 35.
  • 83% of Orkut users are under 35.
A couple of examples of sites with more homogenous user bases, age wise:
  • Hacker News has almost half of its users (44%) in the 18-24 age bracket.
  • Orkut on the other hand has a massive grouping of people aged 25-34. This is so large (76%) that we suspect it may be an anomaly in the Ad Planner data. None of the other sites display such extremes.
  • More than half of DeviantART’s users are below 25.

Average user age per site

Based on the sites in this survey, the estimated age of the average social media user is just under 37 years old. Here are some other observations:
  • The oldest users. LinkedIn has the oldest user base, with the average user being 44.2 years old.
  • The average Facebook user is 40.5 years old.
  • The average Twitter user is 37.3 years old.
  • The age trend for Facebook and Twitter. Compared to a previous survey we did 2.5 years ago, the age of the average Facebook user has gone up two years, while the age of the average Twitter user has gone down two years. In other words, Twitter’s user base is getting younger, while Facebook’s is getting older.
And here is the full chart with all the sites, sorted by average age:
social network average age

What about gender?

This whole article so far has been about the age of people using these social networks and online communities. Now it’s time to examine the male-female ratio, or gender balance if you prefer that word.
Based on the United States demographics data (from Ad Planner) there is a clear gender imbalance on many of these sites. Some are much more male dominated, and vice versa. However, when you look at all the data together, it becomes clear that women rule social media. More than two thirds of the sites in this survey have more female than male users.
Other observations:
  • 17 out of 24 sites (71%) have more female than male users.
  • The average gender distribution is 48.75% male, 51.25% female.
  • Most male-dominated site? Slashdot (87% males) is the standout, followed by Hacker News (77% males) and Stack Overflow (76% males). In general, the more tech-focused sites in this survey have more male users than female.
  • Most female-dominated site? Pinterest (79% females) is in a league of its own, followed by Goodreads (70% females) and Blogger (66% females).
  • Facebook and Twitter have the same gender distribution: 40% male, 60% female.
Here below is a chart with the male-female ratios for all 24 sites included in this survey. The chart is sorted, the least male-dominated sites at the top.
social network gender distr
As you can see, the only sites in this survey with more male than female users are Quora, Reddit, Orkut, Github, Stack Overflow, Hacker News and Slashdot.

Final notes

We hope you found this report interesting. It’s easy to get lost when digging through this kind of data, but we hope we managed to present it in a way that gave you a decent overview of the situation today.
To us, one big takeaway from this report is that there’s a place for everyone in today’s social media landscape. These sites have users that span the entire age spectrum, and there really are no limits to what you can achieve online, regardless of age or gender.
A note on the source data: All the demographics data in this survey is for the United States, but the patterns shown here should translate roughly to other countries as well. That said, there are regional differences, so keep that in mind if you’re applying this to other parts of the world.
Previous surveys: We did a couple of similar surveys almost three years ago (age, gender), but the results are not easy to compare since a different set of sites were used (the social media landscape has changed).
Larger charts: Average age distribution, Age distribution per site, Average age per site, Gender distribution.
Image credit: Top image background via Shutterstock.

This was a post from the guys at Pingdom, a site monitoring service that makes sure you're the first to know when your site is down. Check it out for free.

Thursday, August 16, 2012

iOS 6 vs. Android Jelly Bean: Initial Developer Interest Nearly Identical

iOS 6 vs. Android Jelly Bean: Initial Developer Interest Nearly Identical:
Apple released iOS 6 Beta 3 to developers on Monday, July 16th, and, as with previous releases, there was a significant amount of interest from the software development community. Apple’s newest OS will include features such as a settings menu in the Maps app, allowing the user to control specifications including navigation voice volume and units of distance (miles or kilometers), among others to be unveiled. At Chitika Insights, our team looked to visualize this level of interest, based on iOS 6 Web traffic the first full day the OS was available. Additionally, we wanted to see how this compared to the activity surrounding Android Jelly Bean, which was made available to developers on July 9th. iOS had traditionally seen a great deal more developer activity and app development than Android, due to the heavier usage patterns of iOS users. However, this has slowly changed, and iOS and Android now nearly split the marketplace in half when it comes to usage share, as you can see in our real-time tracker.
To quantify this study, we took a sample composed of hundreds of millions of ad impressions from within the Chitika Ad network on July 10th and July 17th, 2012, respectively. A user agent analysis was then conducted on this sample of data to determine the rate of adoption for iOS 6 compared to other iOS versions available in the market, and a 24-hour rolling average was taken to determine usage rates. The same process was followed for Jelly Bean and Android. A table depicting the results of the July 17th iOS study can be seen below:
Since the release of iOS 6 Beta 2 to developers on June 25, it has held a small but consistent share of the iOS market, hovering around 0.09%. It is expected that the usage rates wouldn’t show a great increase, as those eligible to update to Beta 3 are the same group who could download Beta 2. The day following the Beta 3 release, though, we observed a nearly 10% increase in iOS 6 traffic to 0.11%. The timing of this spike coinciding with the release of Beta 3 indicates a significant adoption rate of the updated operating system, along with an increased interest in using the operating system for Web browsing.
Interestingly, Google’s release of Android Jelly Bean has been met with a nearly identical amount of enthusiasm, with usage rates the first full day following its release, hitting 0.10% of all Android traffic. The graph below shows overall usage share:
Comparing these data sets highlights the evolution of the mobile developer community. Android is now on near-even footing with iOS when it comes to attracting developer interest. However, the fragmentation issues prevalent in Android present a larger problem to developers looking to monetize their creations on the new operating system. Apple CEO Tim Cook was quick to point this out during his WWDC keynote address. However, as both releases develop, website publishers must be sure that their sites are optimized for viewing on the new operating system, with those early mobile adopters often representing the most valuable online consumers.

Samsung’s basis of competition

Samsung’s basis of competition:
Samsung has been selling smartphones for a relatively short time. Although the company sold Windows Mobile, Linux and PalmOS during the last decade, it did not gain significant volumes until it began selling Android phones in 2010 with strong operator support.
That support was substantial in the US. The company crashed the Android party in mid 2010 with its Galaxy brand. Trial evidence reveals that the sales level for Galaxy S1 series phones burst out of the gate taking Samsung from 90k units to 2.5 million units in one quarter.
The following graph shows the unit shipments recorded by Samsung for a set of US smartphones.

Note that the profile of sales volume shows a cyclicality with respect to product launches. Each new generation overlaps with previous generations and “fills in” while the older generation product tails off in sales. This is standard portfolio strategy. It also shows the cycle time of launches is approximately four quarters. As the S1 was four quarters old, the SII launched and the SIII follows after four quarters of SII.
What is surprising is that the overall sales volume is not growing. At least for the products catalogued (which exclude the Note) growth for the last four quarters has been: 5%, 34%, 31%, -53%. These are in stark contrast to the iPhone pattern shown in the outline bars behind Samsung’s.
The iPhone ramped slowly in 2007 and 2008 and has been showing remarkable generational growth.
Perhaps it’s still early and Samsung SIII product will ramp up as the contemporary iPhones do, but if it doesn’t we have entertain the possibility that the iPhone does not compete along the same basis.
What does it mean to compete on a different basis?
The basis of competition is the aspect of an offering for which a customer is willing to pay a premium price. It’s hard to know (or to put your finger on) what the basis actually is, but we can test whether it’s the same by measuring whether two products capture prices the same way. If one product that seems to resemble another can obtain price advantage consistently, then perhaps it’s being bought for a different reason.
To test this, I produced the following chart showing the prices that Samsung’s phones have been able to capture through their lifetimes; and the same for the iPhone.

I’ve narrowed the analysis to the first four quarters and summarized the price erosion across all the products as well:

[Note: iPhone 4S, Skyrocket, T-Mobile Galaxy SII showing only three quarters]
As mentioned, it’s still early perhaps, but the pattern for the iPhone has been different.
Samsung’s pattern is not unusual. I’ve seen similar pattern for almost all Nokia products. Prices drop. It’s a standard industry phenomenon.
Therefore the question is not perhaps what is Samsung’s basis of competition: it’s the same as the overall phone industry. The question is what is the basis of competition for the iPhone.


American exceptionalism

American exceptionalism:
The second quarter showed continuing growth for Android with 19 points of share growth from a year ago. Only Windows Phone showed a gain y/y in share up 1.6 points to about 3%. In the same time, Bada lost half a point, iOS lost 2.1 points, RIM lost 7.2, Symbian 11.4.
The result is shown in the graph below:

I also show a “before-and-after” pair of pie charts which show the difference in smartphone platform market share from the same quarter three years ago. Android went from 3% share to 67% while Symbian went from 41% to 4% and RIM went from 19% to 5%. iOS increased its share from 13% to 17%.
If this trend continues Android could reach 50% of all phones sold in a few years. That’s a run rate of 200 million per quarter. And it’s likely that 100 million of those will be shipped by Chinese vendors.
However, looking at the global picture can also miss some important trends in local markets. Had one looked at the global smartphone business in 2005, the conclusion would have been that Symbian would be the dominant platform in perpetuity.
What affected the global market was a change in the US: the launch of iOS and thereafter of Android. The US, a smartphone backwater until then, became the most vibrant market and today it’s the most penetrated and has the highest ratio of smart to non-smart of any of the major regions.
The curious thing about this vast market is that it’s still not truly open. There are technology and political reasons why some platforms are permitted to sell in one region or not. The iPhone is not available on either the largest Chinese operator or on the largest Japanese one. It’s largely absent from India because of distribution (i.e. subsidy) and much of South America. Even in the US, the iPhone is still, after five years, not available on one of the top four operators and has only reached another less than a year ago.
What intrigues me is what would the market look like if distribution were not an issue. What if there was equal choice to all buyers. We can’t test this question directly but we can ask. But there is some pattern we can look at in the US data. Thanks to recent revelations at the Samsung vs. Apple trial we can see the effect of increasing distribution in the US.
The data on smartphone market share by carrier can be blended with data from carriers about iPhone activations (which are a proxy for sales, see note below) to give a more precise figure of market share in markets where iPhone participates.
For example, when the iPhone was only available on AT&T, one could measure iPhone market share vs. the global smartphone market, or the US smartphone market or within AT&T alone. Some assumed that the AT&T share would be reduced once the product would become available on Verizon or other US carriers. However there was no appreciable drop. Share in Q4 2010 was 63% at AT&T and it was 63% a year later after the iPhone was available for four quarters at Verizon.
So the share of iPhone within those operators which carry it tells a story independent of distribution.
The following graph shows the share of the iPhone vs. Samsung in the market defined by its availability. (I.e. the volumes of smartphones sold by AT&T throughout the time period, Verizon Q1 2011 to end and Sprint in Q4 ’11).

The share of iPhone thus defined shows a slight decline but it’s an overall number that is remarkably resilient as distribution increases and is remarkably high overall. Note that globally, the iPhone gets only about 17% share of smartphones–a value that has not varied greatly since mid 2009.
So at least in the US, on carriers where it’s available, the iPhone is holding on to a significant share. In a global market it’s expanding distribution but not yet covering the world. As a consequence it’s keeping up with overall market growth and staying between 17% and 20% share.
The big question is what will happen if and when its availability matches that of Android in terms of points of sale. Or even that of BlackBerry or Symbian. Is America a different market from the rest of the world? It was different in being isolated while Symbian roamed globally. It was different in being a launch platform for BlackBerry and then iOS and then Android. But now that iPhone is beginning to be widely available there, will it be exceptional in how it rewards Apple?

Note:
  1. Activations data can be seen next to Apple’s testimony of US sales in the following graph. Note that more phones were sold by Apple than were activated in total of the life of the product. 86 million sold and 80 million activated. This implies that an analysis based on activations undercounts the iPhone. 


Web Browser Market Share, July 2012 Update

Web Browser Market Share, July 2012 Update:

Operating System Market Share, July 2012 Update

Operating System Market Share, July 2012 Update:

Mobile Manufacturer Market Share, July 2012 Update

Mobile Manufacturer Market Share, July 2012 Update:

Friday, August 10, 2012

State of the tablet market (a.k.a. The Tablet Wars)

State of the tablet market (a.k.a. The Tablet Wars):
tablet war
Apple has been dominating the tablet market ever since the company released the iPad, so calling the current situation a tablet war might be a bit overly dramatic. But things are heating up. The number of Android-based tablets is growing, and now even Google itself has joined the fray with the Nexus 7.
What is the current standing in this “tablet war,” and how does it differ across the world? Luckily, we can get an idea by using data from StatCounter. Their data is based on web usage (visitor stats from 3+ million websites), so it will represent the tablets actively used to surf the web.
As you’ll see, it basically comes down to the collective might of all Android tablet makers versus Apple’s iPad. Microsoft’s entry into the tablet market with Windows 8 isn’t here yet, and it remains to be seen if it will make an impact or not. Blackberry OS and webOS have disappearingly small market shares, and don’t seem to be a threat to anyone at the moment.
So, without further ado, here is the current lay of the tablet land…
tablet OS faceoff

(Larger version.)
Note that these OS numbers are only for tablets, not smartphones or other small-screen devices.
The iPad clearly still dominates across the board, in all parts of the world. The only difference is by how much.
Another way to look at these numbers is that for every Android tablet in use today in the world, there are 6.6 iPads.

Android has gained a bit, but not much

Comparing these results with the numbers from a similar survey we did back in November last year, Android has gained a bit of market share at the expense of the iPad, but not much.
Since last November, Apple’s iOS has gone from 87.9% to 85.7%, Android from 10.9% to 13.0%. These are relative numbers, of course. The absolute number of tablets out there is growing by leaps and bounds, so both Android and iOS are gaining users.

A few notes

  • There are countries where the iPad has over 90% of the market. These include the United Kingdom (93.1%), Australia (93.2%), Ireland (90.2%), New Zealand (90.6%), Sweden (91.2%), Norway (92.7%), Denmark (95.0%), Iceland (93.6%), Switzerland (91.7%).
  • Since it would seem that the iPad is doing very well in slightly more affluent countries, we had to check Monaco. And yes, iOS has 96.1% of the tablet market there.
  • In the United States, iOS has 88.4% of the tablet market, Android has 10.3%, webOS has 0.8% and Blackberry OS has 0.4%.
  • Worldwide tablet market share for Blackberry OS is 0.97%. The standout country here is RIM’s home market, Canada, where Blackberry OS has an 8.5% market share.
  • Worldwide tablet market share for webOS is 0.32%.
  • One could perhaps expect that with South Korea being the home market of Samsung and LG, Android-based tablets would have a favored position. That doesn’t seem to be the case though, with iOS at 81.5% and Android at 18.5%.
  • Places where Android is doing relatively well against iOS include Thailand (iOS 76.5%, Android 23.5%), Taiwan (iOS 79.2%, Android 20.8%), Saudi Arabia (iOS 75.3%, Android 24.3%), Brazil (iOS 79.8%, Android 20.2%), Argentina (iOS 72.4%, Android 25.0%), Poland (iOS 77.0%, Android 23.0%), South Africa (iOS 74.5%, Android 25.1%) and Russia (iOS 77.8%, Android 22.2%).
  • A few real standouts for Android that we found were India (iOS 66.0%, Android 31.9%), Indonesia (iOS 55.6%, Android 44.0%) and Malaysia (iOS 62.8%, Android 36.8%).
  • One thing boding very well for Apple is that according to these numbers the iPad currently has 89.0% of the tablet market in China. That’s not a small market…
We’re using the term market share loosely here. What we’re really talking about is share of web usage, as we’ve pointed out earlier. You could think of it as a rough analogy for “share of tablets actually in use.”

Final words

There are quite a few Android tablets out there by now from companies like Samsung, HTC, Asus, Sony and Amazon (whose Kindle Fire is possibly the best-selling Android tablet to date).
Now it remains to be seen how Google’s entry into the tablet market with the Nexus 7 will affect these stats. They will have to sell an awful lot of tablets to upset the current balance, considering how well the iPad is selling (Apple sold 17 million iPads during its latest fiscal quarter).
Challenging Apple’s dominance will be even more difficult if Apple does indeed release a smaller iPad this fall, as the rumor goes.
Even if we give some room for error in the estimates in this survey, it’s probably fair to say that the iPad currently has somewhere between 80-90% of the worldwide tablet market today. If Apple can remain a dominant player in the long run remains to be seen, but for now it’s doing just fine against the onslaught of Android-based devices that have come into the market.
Image credit: Tablets used in top image via Shutterstock.

This was a post from the guys at Pingdom, a site monitoring service that makes sure you're the first to know when your site is down. Check it out for free.

iPad Takes Slight Dive, Samsung, Google See Tablet Success in July

iPad Takes Slight Dive, Samsung, Google See Tablet Success in July:

Perspective and Context in Personal Computing

Perspective and Context in Personal Computing:
The Mac grew at the extremely low rate of 1.8% over last year’s second quarter. Although it grew faster than the Windows PC market, the gap has narrowed quite a bit. The following graph shows the growth of the two members of the computing Ancien Régime.

We have to wait a few more quarters before we can decide whether the Mac will enter a new phase of diminished expectations. Although it’s not immune from the impact of the iPad, the effect can take a long time to be evident and in either case, growth can come from conversion of Windows users which vastly outnumber loyal Mac users who might upgrade.
If we see the computing market as the superset of keyboard+mouse input and touch-based input then new computing consumption becomes easier to spot:

Seen this way, rather than there being a crisis in personal computing, we have a renaissance. And as in the actual Renaissance, it’s a volatile and unsettling period.
Nowhere more so than in the changing of bases of power. Consider the following data:

A change in perspective leads one to conclude that Apple is the new leader in selling personal computers. Maybe this charting is putting too fine a point on it, but the data is beginning to make evident that which has been perceived subjectively by only a few.

The biggest loser

The biggest loser:
According to data from comScore, in the past 24 months 50 million Americans became Android phone users. In the same time frame Apple added 24 million iPhone users. As I mentioned in my Asymmetric Competition post, it would be unwise to consider this data in isolation. Consider the following graph showing the net change in users in the US.

Android and iPhone grew mostly at the expense of non-smart users. The BlackBerry lost 8.1 million users and all the others only lost about 4.5 million.
With penetration at 50% it’s still impressive that there is so little “churn” between platforms. In fact, measuring churn as the net platform user loss as a percent of all smartphone users, we get something less than 1% per month.
The smartphone competition is still primarily with non-consumption.
That will change at some point when smartphone penetration (shown below) will begin to saturate. The basis of competition will have to shift from converting non-smart users to converting users of other platforms while maintaining one’s own user base.

The market has not experienced this sort of rivalry on a wide scale. The defections of BlackBerry and Symbian users are relatively rare events.

The iPad Halo Effect – A coming boost for Apple

The iPad Halo Effect – A coming boost for Apple:
ipad
The heyday of the iPod was a huge deal for Apple. For many people, it was the first Apple product they owned, and those who fell in love with it often went on to buy other Apple products. This was sometimes referred to as the iPod halo effect, and gave Apple a mass-market reach it had never had before. Without the iPod, Apple wouldn’t have been anywhere near as successful in the past decade.
Much of that halo effect has since moved over to the iPhone, which the last couple of years has been an even more successful entry point, funneling millions of people into the Apple ecosystem. The effect of the iPod is still there, but it’s not as prominent due to the massive success of the iPhone.

Enter the iPad, the new entry point

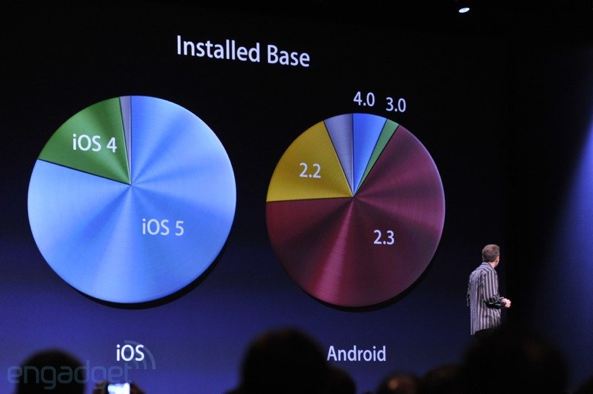
As we showed earlier this week, iPad is almost completely dominating the tablet space, at least for now. If we see a repeat of the way Apple handled the MP3 player market, they may never release that dominance (the iPod still has over 70% of the MP3 market).
So Apple has a huge hit on its hands. They just sold 17 million iPads in three months. Extracted over a year, that is 68 million iPads, and it’s quite possible that those numbers will be even higher as the iPad grows in markets such as China, not to mention the possible impact of a smaller, more affordable iPad if Apple does release one as rumored.
iPad sales
Note how sales have been more than doubling year over year when you compare the same quarters, e.g. from 7.3 million in Q4 2010 to 15.4 million in Q4 2011. If this pattern holds, we will see Apple sell more than 30 million iPads in Q4 2012.
These numbers may seem fantastic, but the iPad is Apple’s most successful product launch ever in terms of unit sales. Considering how popular the iPhone is, that is saying something. Earlier this year, Horace Dediu of Asymco put together a very telling chart, showing how fast those iPads are selling compared with other Apple products:
apple device sales
Now imagine a few more years of that. Where will the iPad be then? (And the iPhone…)
With the iPad selling like ice cream on a hot summer day, it will pull in more users to Apple’s ecosystem. The iPad will create new Apple fans, which is exactly what Apple is counting on. The company is waiting with open arms

Apple’s ecosystem approach

Apple’s entire product line is designed to maximize the halo effect between different devices. All of Apple’s devices play nice with each other, and that has been getting better and better over the years.
Apple is really good at this, and since they have full control of both software and hardware they can integrate their products in ways most other companies can only dream about.
We’d be extremely surprised if the good people at Apple weren’t very aware of how people flow between their different products and how new users arrive. And being aware of that, of course they want to funnel as many of their new users into other Apple products as well. Sales begets more sales, like a chain reaction.

Apple’s retail stores enhance this halo effect

Over the past decade Apple has built a significant physical retail presence. The first Apple retail store opened in 2001, and today there are 373 worldwide. Millions of people walk through those doors.
And what do consumers see in these stores? They see the entire Apple ecosystem; iPhones, iPods, iPads, Macs, all displayed together. In a regular store with many brands competing for attention, that cohesiveness would not be as visible. Here, however, it is obvious.
It’s another way Apple can say, “look, we have this for you, but we also have these other things here, and they all play nice together.”

The iOS feedback loop

The similarity between the iOS-based iPad and the iPhone is very convenient for new Apple users. If you can use one, you can use the other, your interaction with them is very similar.
Since it’s very easy to go from the iPhone to the iPad, and vice versa, and both act as entry points into the Apple ecosystem, this creates a positive feedback loop. What we mean here is that iPad sales are bound to trigger iPhone sales, and iPhone sales are bound to trigger iPad sales, and so on. And some of that will also spill over into other Apple products.
(With that in mind, Apple’s increasing “iOS-ification” of Mac OS X makes perfect sense; it delivers a more uniform experience for Apple’s users across iOS and Mac OS X.)

Apple’s tablet advantage

Even in a tablet market that is barely getting started, Apple is catching a whole slew of new users thanks to the iPad.
Android-based tablets, on the other hand, haven’t seen anywhere close to that kind of success. When looking at tablet market share based on web usage, Android only has 13%, compared to 86% for iOS (iPad). So there should be almost no halo effect in place for Android (not to mention that it’s a more fractured device lineup with many different tablet makers).
This, we suspect, bodes well for the iPhone. And what is good for the iPhone is good for the iPad. Again, that positive feedback loop in effect.

Final words

For this to turn into a good thing for Apple, people need to be satisfied with their iPads. If users don’t fall in love with their iPads, there won’t be a halo effect. Good thing for Apple that the iPad is so well received (it wouldn’t be selling as well otherwise, of course). For example, there is a recent survey from ChangeWave showing a 98% satisfaction rate, with 82% being very satisfied.
It’s also interesting that with its ease of use, the iPad could well be casting a net wider than even the iPhone. Most people today don’t have smartphones, but many are getting tablets, and most of those are iPads. And when those people finally decide on getting a smartphone? It’s very likely that’s going to be an iPhone. And so they take another step into Apple’s garden. There is a certain time delay involved, but it will happen.
We don’t have hard statistics to lean on here, but anecdotal evidence indicates that this is already happening. We asked around, and several of our friends have parents who don’t have Macs or iPhones (or even smartphones) but recently got iPads. And they love them. And guess what, some plan on getting an iPhone soon, or at least the next time they replace their mobile. That’s the iPad halo effect in action.

This was a post from the guys at Pingdom, a site monitoring service that makes sure you're the first to know when your site is down. Check it out for free.

How many iPhone “5″s will be sold?

How many iPhone “5″s will be sold?:
Phil Schiller stated (under oath) that when assessing sales for a new model of the iPhone, Apple used an easy shorthand:
Each new generation sold approximately equal to all previous generations combined.
That’s a helpful gauge. Did it hold and will it continue to hold?
In order to test this rule of thumb we need to know generational sales. Although we know overall unit sales for a given quarter, since Apple has been selling several versions simultaneously, we need to make some guesses about the ratio of generations in the mix. My guess is about 10% for 3G vs. 90% 3GS and 5% 3GS vs. 10% 4 vs. 85% 4S. That results in the following pattern:

The cumulative totals for these generations can then be generated and they appear as follows:

The solid bars are the shipments for each generation (to date) and the outlined bars are the cumulative shipments of all prior generations. The assumptions show that:
  • The 3G easily outsold the original iPhone. In fact, it sold nearly four times as many.
  • The 3GS also handily beat the 3G+original total by a factor of 1.6
  • The 4 also beat the 3GS+3G+original. As the 4 may continue to sell into the future, the beat will only grow larger.
  • The 4S is only half way through beating  the 4+3GS+3G+original. Assuming the current quarter’s sales roughly equal the last quarter’s, the total for 4S will reach two thirds of the sum of the previous generations (i.e. 100 million) by the end of September. Bearing in mind that the 4S is likely to remain in production at least one more year means it has a potential to come close to the target of 162 million.
This leaves us with the question of how many iPhone “5″s will sell. As it stands today, the cumulative total would have to be greater than 263 million units (including assumptions for the current quarter.) That target is shown below:

Is that a reasonable target?
Unfortunately, this is a moving target. As the 4S (and maybe 4) remain in production, the target continues to increase with time. However, we can still take a stab at this.
Recall the analysis of production based on budgeted CapEx spending. It resulted in a best guess of about 165 million iOS units sold in the following two quarters. I further forecast iPhones in isolation to be about 102 million over the same period. Taking that forecast forward and assuming a 60% growth rate,  I currently have about 200 million iPhones over the next twelve months. If 85% of those are the next generation, that yields about 170 million iPhone “5″s through mid 2013.
This is well short of a target of 265 million. But that’s only over the next four quarters. If the iPhone “5″ remains in production for at least as long as the 3GS then it might cross 200 million. There is also the question of whether the “mix” will begin to favor the older generations more. If that’s the case, we might see version “5″ meet its target.
Underlying all this is the question of a change in strategy toward more penetration (vs. current skimming.)  That might allow for sustaining the 100% historic growth rate. If so then Apple will easily sell 250 million iPhone “5″s.

Measuring iOS as a gaming platform

Measuring iOS as a gaming platform:
At this year’s WWDC Apple offered an update on Game Center accounts. The data we have so far is shown in the following graph.

Before being acquired, another network, OpenFeint, announced 180 million iOS accounts in October 2011. Another figure to consider is the 40 million subscribers to Xbox Live (out of 66 million Xbox users). This subscriber base is paying for a service (about $1 billion per year) so it’s not the same as the free Game Center model.
Rather than being a revenue source, Game Center is designed to engage users and to capture usage information. It also lets us gauge gaming “consumption” on iOS devices. That itself allows us to contemplate it as a gaming platform vis-à-vis alternate platforms.
To consider the figure as a proxy of penetration and engagement, the graphic below shows cumulative sales of gaming devices.[1]

Here are some observations:
  • There is a pattern of turnover of market participants
  • Each console “generation” had a clear market leader
  • The best-selling gaming device was the Nintendo DS closely followed by the PlayStation 2 [2]
  • Considering the 130 million Game Center accounts, iOS is already the third largest gaming platform
  • Furthermore, considering the OpenFeint iOS figure of 180 million accounts announced in 2011, iOS has already surpassed the cumulative sales figures for the Nintendo DS
  • No gaming device has ever reached the 200 million mark
  • At the current growth rate the number of Game Center accounts will surpass 200 million before the year end
Apple cites the number of games, downloads and payments to developers as evidence of ecosystem health and growth. The figure of Game Center accounts is yet another indicator. It shows growth in and of itself, but it also has the side effect of offering comparative measurement of performance. That measurement compares favorably with other game platforms.
The economics are different but they always are when a disruption takes root.

Notes:
  1. Based on reported cumulative sales (Wikipedia), excluding gaming devices with less than 10 million cumulative sales (excludes for example PlayStation Vita), excludes also “home computers” due to missing reported figures
  2. This Wikipedia article contradicts the previous.