Survey Report: Android And iOS Most Popular Development Platforms, But Developers Looking For Alternatives:
Market strategy firm Vision Mobile just released their fourth annual survey report “Developer Economics 2013″. For the report, subtitled “Developer Tools: Foundations of the App Economy”. 3,460 developers across 95 countries were surveyed. The report contains interesting insights into developer mindshare, revenue and lead platforms. This report specifically, also focuses on developer tools, incl. ad-networks, back-end as a service, cross-platfrom tools, cross-promotion networks, user analytics, and voice services.
The full report is available free of charge here.
We would like to highlight a few of the findings regarding app distribution in the app stores.
Android continues to lead mobile developer mindshare, with 72% of developers now developing for the platform, a 4 percentage point increase compared to our 2012 survey. iOS shows a 5 percentage point drop, to 56%, in Mindshare, which we attribute mostly to the influx of Asian developers showing a clear preference towards Android. The considerable share of mobile developers intending to adopt Windows Phone (47%) and BB10 (15%) indicate that there is still developer interest in a viable third app ecosystem.
The report also gave some insights into the effect on revenue of developing for multiple platforms. 74% of developers use two or more platforms concurrently. On average mobile developers use 2.6 mobile platforms in our latest research, compared to 2.7 in 2012 and 3.2 in our 2011 research. The Android-iOS duopoly in smartphone sales is gradually creating a concentration of developers around these two platforms: 80% of respondents in our sample develop for Android, iOS or both, making them the baseline in any platform mix. Developers that do not develop for one of these two platforms generate, on average, half the revenue of those developers that do, leaving little doubt as to the concentration of power within these two major ecosystems.
For more results from the survey, you can download the full report here.
Live blogging Feed
Thursday, January 31, 2013
Tuesday, January 29, 2013
Report: Amazon dominates Android tablets, US-based Kindle Fires alone are 33% of global devices
Report: Amazon dominates Android tablets, US-based Kindle Fires alone are 33% of global devices:
Google entered the tablet market with its Nexus 7 range last year but it is Amazon, the US retailer that has a somewhat strained relationship with the search giant, that is dominating the Android tablet market worldwide with its Kindle Fire range, a new report claims.
Research from mobile app analytics service Localytics which goes live tomorrow shows that the Kindle Fire is by far and away the most owned Android tablet on the planet. The company estimates that the number of Amazon Fire devices in the US alone represents 33 percent of all Android tablets worldwide — while the US itself is the world’s biggest tablet market with a 59 percent market share.
There is a key reason behind that factor, namely the limited availability of the Kindle Fire range itself. Initially available in the US only, Amazon later released its devices in selected European markets but Localytics estimates that 89 percent of Kindle Fires are based in the US.
Localytics doesn’t break out device metrics for other tablets but, with US based Kindle devices according for a third of all Android tablets worldwide, it is well ahead of the Nexus 7 (US ownership is 8 percent of the worldwide total), Samsung’s Galaxy range (9 percent) and Barnes and Noble’s Nook (10 percent).
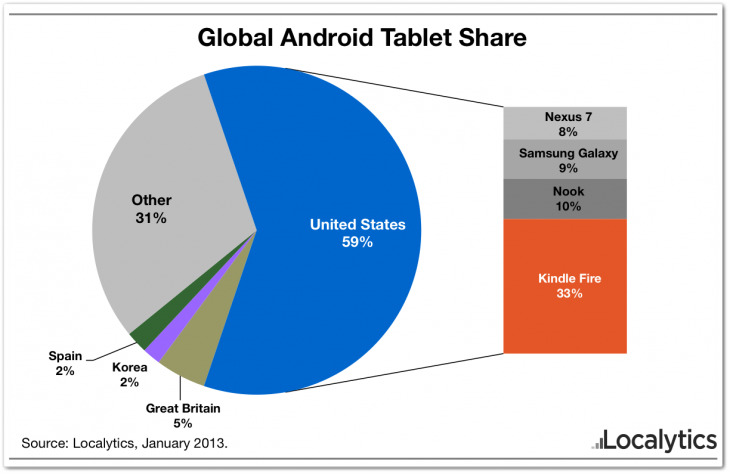
Of course, it goes without saying that these are estimates (notably devoid of raw sales or shipments figures) but they present an interesting snapshot of the Android tablet market as it stands today. Localytics says it has “insights into over 500 million unique devices” which have run its analytics and in-app marketing solution.
Apple’s iPad has long defined the industry, there’s no doubt in that, but it stands to reason that the broad range of Android partners and devices that they produce will, at some point, eat into Apple’s dominance of the market — as has happened with global smartphone numbers. Likewise, the growing maturity of Google’s Nexus 7 tablets are likely to challenge Amazon. Though initial supply has been limited, consumer demand has been buoyant…though Google lacks the range of devices, width of price points and market maturity of the Kindle Fire.
Over time one might expect adoption of Android tablets to grow out of the US, and likewise Amazon’s share of the Android tablet eco-system to lessen as devices from others grow their footprint overseas. However, running counter to that, Amazon is focusing on taking its success global but internationalizing the Kindle. Given that it makes a loss on the sale of devices — content is its real money earner — it has the potential to use aggressive pricing strategies to draw in new and existing tablet owners across the world like few other players can.
Indeed, it could be hugely disruptive in China when it finally launches there. Amazon’s app store has already gone live in the country, so it seems like it is only a matter of time before the Kindle, Kindle Fire and others arrive.
As it stands today, aside from the US and UK, Localytics says that “no other country has even one percent of worldwide Kindle Fires”. We know that tablet option is at its highest in Western markets, that can be seen as a huge opportunity for growth, or potential for the competition.
Enders Analysis analyst Benedict Evans recently looked at what Google stands to gain from Android. While much of the motivation is to help technology reach the hands of new users, Google’s services are baked into the operating system. As it stands, given that Amazon’s own fork of Android cuts out a number of key Google properties — most notable the Google Play app and content store — its continued dominance is lessening the impact of said Google services in Android.
Overall, the takeaway for Android developers is clear, ignore the Kindle at your peril, as Localytics explains:
In the meantime, any Android developer with a focus on tablets should be distributing their apps in the Amazon App Store. The degree to which Amazon has dominated their most serious geographical market should speak to the future potential, and since Google Play is unavailable on the Kindle Fire family, adding Amazon’s App Store as a distribution channel is important.Headline image via by who_da_fly / Flickr
Friday, January 18, 2013
Thursday, January 17, 2013
Smartphones: Still Room to Grow in Emerging Countries
Smartphones: Still Room to Grow in Emerging Countries:
Methodology
China and Russia – Online survey of 3,900 mobile subscribes aged 16 and older who were asked to identify what type of mobile device they own. Due to the online-only methodology in China, which excludes a large portion of China’s rural population, smartphone penetration may skew high.
India – In-person interviews with 3,900 mobile subscribers aged 16 and older who were asked to identify what type of mobile device they own.
Brazil – Phone interviews with 1,000 mobile subscribers aged 16 and older who were asked to identify what type of mobile device they own.
Look for Nielsen at Mobile World Congress 2013 where our mobile experts will present insights on the everyday mobile behaviors of global consumers.
While smartphones have gone mainstream in many regions around the globe, adoption among emerging countries is still developing. According to new research from Nielsen, China is the only country among the high-growth BRIC (Brazil, Russia, India, China) markets where smartphones are predominant, owned by two-thirds of Chinese mobile subscribers as of the first half of 2012. In contrast, feature phones—devices with no touchscreen, QWERTY keypad or operating system—are still dominant in India and Russia, owned by 80 percent and 51 percent of mobile subscribers, respectively. There’s no clear favorite type of mobile device in Brazil, with mobile ownership split between 44 percent feature phones, 36 percent smartphones and 21 percent multimedia phones (touchscreen and/or QWERTY keypad, but no operating system).
Much in the same manner as social media, smartphones–with their advanced functionality and access to a multitude of apps–influence everything from consumers’ interaction with both brands and each other, to and shopping and purchase decisions.Methodology
China and Russia – Online survey of 3,900 mobile subscribes aged 16 and older who were asked to identify what type of mobile device they own. Due to the online-only methodology in China, which excludes a large portion of China’s rural population, smartphone penetration may skew high.
India – In-person interviews with 3,900 mobile subscribers aged 16 and older who were asked to identify what type of mobile device they own.
Brazil – Phone interviews with 1,000 mobile subscribers aged 16 and older who were asked to identify what type of mobile device they own.
Look for Nielsen at Mobile World Congress 2013 where our mobile experts will present insights on the everyday mobile behaviors of global consumers.
Monday, January 07, 2013
World map of top social networks shows just five left, Facebook dominates 127 out of 137 countries
World map of top social networks shows just five left, Facebook dominates 127 out of 137 countries:
Every June and December, social media strategist Vincenzo Cosenza updates his “world map of social networks” to show what the most popular service is in every country around the world. The latest update, for December 2012, reveals that we’re down to just five top social networks, and that Facebook now dominates 127 of the 137 countries worldwide tracked by Alexa.
With over 1 billion monthly active users, more than 600 million of which are mobile, it’s not surprising that Facebook has retained its number one spot. If anything, the service has all but ran out of countries to conquer: it now faces the tough battle of unseating very popular local competitors in countries where governments block the site.
Nevertheless, Facebook’s continued dominance is mainly thanks to growth in Asia where it has some 278 million users, according to the Facebook Ads Platform, recently surpassing Europe’s 251 million as the largest continent on the site. North America has 243 million users, South America has 142 million, Africa is at almost 52 million, and Oceania has just 15 million. In 2012, Facebook became the number one social network in Armenia, Kyrgyzstan, Latvia, and Vietnam.
The December 2012 edition of Cosenza’s map shows that the following five social networks are at the top in at least one country in the world: Facebook, QZone, V Kontakte, Odnoklassniki, and Cloob. In Russian territories, V Kontakte is beating out Odnoklassniki thanks to its now 190 million registered users, while QZone owns the Asian landscape with 552 million users, and in Iran, Cloob has taken over since Facebook access is difficult due to state censorship.
Let’s compare this to the previous reports. There were 17 social networks in June 2009, 16 in December 2009, 14 in June 2010, 11 in December 2010, nine in June 2011, six in December 2011, and seven in June 2012. Social networks Drauglem and Zing were knocked off by V Kontakte and Facebook, respectively.
How long will it be before Facebook starts losing its prized number one spot?
Sunday, January 06, 2013
When will smartphones reach saturation?
When will smartphones reach saturation?:
50% penetration for smartphones in the US turned out to be fairly predictable. I tracked my predictions based on comScore data and the results are shown in the following graph.
I began making predictions in May 2010 and updated the estimate every month since. As the chart shows, the prediction converged to early September 2012 by early 2011. The actual date was sometime in late August 2012.
The reason this prediction was relatively easy was because the rate of penetration growth was mostly linear throughout the period of 2009 to 2012 or from 17% to 50%.
In fact, the consistency continues even above 50%. The following chart shows the weekly new smartphone users add rate. No slowing seems to be evident for the few months since 50% penetration was achieved.
So if we assume that this rate will be preserved or increase slightly, how soon can we expect smartphones will reach 80% penetration in the US?
My guess is now August 2014.
Jelly Bean Claims 14% of Android Web Usage in Six Months
Jelly Bean Claims 14% of Android Web Usage in Six Months:
As a leading open source platform, Android has a lot of things going for it. However, version distribution fragmentation is a problem that has plagued the OS and its manufacturing partners since almost day one. To identify the current level of version fragmentation seen in the Android OS, Chitika Insights conducted a research study sampling data from the Chitika Ad Network.
To quantify this study, Chitika Insights analyzed a sample of tens of millions of Android impressions (both phones and tablets) running through the Chitika Ad Network. A user agent analysis was conducted to determine whether Android was the OS of the mobile impression. This data was drawn across a seven day period, ranging across December 28, 2012 to January 3, 2013 from impressions originating in the US and Canada. A graph depicting the latest Android version distribution can be seen below:
Gingerbread stands as the leading version of Android, responsible for 42% of all usage. Ice Cream Sandwich, one of the more recent versions of Android, captures second place, accounting for 34% of all Android usage. Finally, Jelly Bean, the most recent version of Android, makes up 14% of all Android usage – certainly a step in the right direction.
Stay tuned to Chitika Insights for future research and reports focusing on Android and the Mobile industry.
Friday, January 04, 2013
IE10 below 1% market share, Firefox back under 20%, Chrome recovers from three months of losses
IE10 below 1% market share, Firefox back under 20%, Chrome recovers from three months of losses:
December 2012 finished off last year with quite some interesting moves from the top three browsers. It was the second full month of IE10 availability as well as the first full month of Mozilla Firefox 17 and Google Chrome 23. The latest market share numbers from Net Applications show that Firefox and Safari were the only losers at the end of 2012.
See also – Windows gains market share after six months of decline: Windows 8 grabs 1.64%, Windows 7 passes 45%
Between November and December, Internet Explorer gained 0.01 percentage points. Firefox meanwhile fell a whopping 0.62 percentage points, while Chrome managed to gain a huge 0.80 percentage points (though it still did not manage to regain its losses from the previous month). Safari dipped 0.09 percentage points and Opera picked up 0.04 percentage points.
At 54.77 percent, Internet Explorer is still growing, although more slowly. While it may not have ended the year with 55 percent of the pie, it still has more than half of it. Despite Windows 8′s release, however, IE10 is having a hard time pushing things forward.
IE10 managed to capture just 0.96 percent in December, while IE9 grew to 21.35 percent (up by 0.55 percent percentage points). IE8 lost just a sizeable 1.20 percentage points, but it’s still the world’s most popular browser at 23.29 percent. IE7 dipped 0.15 percentage points and IE6 somehow managed to gain 0.01 percentage points. Everyone can’t wait for it to fall below the 5 percent mark, but that won’t happen till sometime this year; even Microsoft wants it to die; but China isn’t letting that happen.
At 19.82 percent, Firefox has once again fallen under one-fifth of the market, a spot it seems to be hovering around. Firefox 17 managed to grab another 9.59 percentage points, at mainly Firefox 16′s expense which fell 9.65 percentage points. All the older versions lost share: Firefox 15 was down 0.36 percentage points, Firefox 14 was down 0.13 percentage points, and Firefox 13 lost 0.08 percentage points.
At 18.04 percent, Chrome is still just behind Firefox, and now it’s finally gaining again. After three months straight of losses, Google’s browser has failed to pass Firefox in 2012, but is likely to do so this year. Chrome 23 was up 4.90 percentage points, while all the other versions lost share. Chrome 22 was down 3.43 percentage points, Chrome 21 fell 0.12 percentage points, and Chrome 20 dropped 0.21 percentage points. It’s great to see the majority of Chrome users on the latest version.
Before 2012 was out, I predicted IE9 to pass IE8, Chrome to pass Firefox, and for IE10 to start a steady growth, all before the end of the year. The first two did not happen, and the third is showing a weak start so far.
Net Applications uses data captured from 160 million unique visitors each month. The service monitors some 40,000 Web sites for its clients. StatCounter is another popular service for watching market share moves; the company looks at 15 billion page views.
To us, it makes more sense to keep track of users than of page views. Nevertheless, for December 2012, StatCounter listed Chrome as first with 36.42 percent share, IE in second with 30.78 percent, Firefox in third with 21.89 percent, Safari with 7.92 percent, and Opera with 1.26 percent.
Update: Net Applications tweaked its figures and the data in this post has been updated accordingly.
Image credit: Hugo Humberto Plácido da Silva
Smartphone Wars in Asia
Smartphone Wars in Asia:
In a special release for October, we partnered with AIP Singapore to look at Asian sentiments towards smartphones in Asia, which found that nearly one in five Asians who were early iPhone buyers said the phone has failed to meet their expectations, whilst one in 3 intend to buy a smartphone in the next 12 months.
The last feature phone
The last feature phone:
During the last 12 months 31 million American phone users abandoned the use of feature phones. During the last 24 months over 60 million switched. Over 550k users are switching every week and this rate of switching has not changed much since late 2009.
Some of this switching has to do with demand for smartphone services but some of it is also due to a decreasing supply of non-smart phones. The shelf space being allocated to smartphones is nearing 100%. My single sampling of a Wal-Mart store shows the following data:
Looking at individual carriers, AT&T ranged one feature phone and 7 smart SKUs. Verizon’s ratio was 2:8 and T-Mobile’s was 4:5.
T-Mobile has been lagging in smartphone adoption and as they transition in 2013 it’s possible that the AT&T ratio of 12% shelf space dedicated to feature phones will become the norm for the US. And as the US goes, the world will follow.
With shrinking shelf space comes an accelerated decline in the product category. It may not come in 2013, and perhaps not buy 2014 but it’s quite possible that by 2015 the last feature phone will make its appearance in the US.
iPad Tablet Web Share Falls 7.1% Following Christmas Holiday
iPad Tablet Web Share Falls 7.1% Following Christmas Holiday:
The biggest shopping season of the year has passed, and gift recipients are getting to know their brand new devices. This was expected to be a big season for smartphones and tablets, and usage figures observed across the Chitika ad network do not disappoint. Chitika Insights examined smartphone and tablet traffic before and after Christmas Day, analyzing shifts in Web usage volume as well as market share fluctuations, and found some striking results.
To quantify this latest report, Chitika Insights surveyed a sample of hundreds of millions of smartphone and tablet impressions from the Chitika Ad network. This study was drawn from a date range of December 1st to December 27th 2012, and only includes traffic from the U.S. and Canada. The results can be seen below:
Among smartphones, the iPhone 5 and Samsung Galaxy S III were the biggest winners of the holiday season, posting 1.1% and 1.0% gains in smartphone usage share, respectively. Samsung also extended its lead within the large-screen smartphone, or “phablet,” market with share gains by its 5.5”Galaxy Note II, while competitor HTC saw no share gain for its 5” Droid DNA.
Perhaps the most interesting result of this study concerns the iPad. The tablet which brought the product category into the mainstream, Apple’s product has long been the king of the market. However, this Christmas marked a serious diversification in tablet shares, with the iPad falling 7.1% in its share in the days after Christmas, from 86.0% to 78.9% following the holiday.
This substantial change underscores the inroads non-iPad tablets made this holiday season, reflecting some initial holiday sales estimates released by companies like Amazon. Their Kindle Fire HD tablet was the top-selling product on Amazon.com on Black Friday. However, despite the gains by competitors, we expect that the iPad’s share of tablet traffic will return to the 80% range, albeit lower than pre-holiday levels, as users return from vacation and browse with their new devices less frequently.
Thursday, January 03, 2013
In search of Apple’s microprocessor
In search of Apple’s microprocessor:
Digitimes Research published an estimate of the allocation of production of application processors by Samsung. It suggests that Apple will transition away from Samsung as a processor supplier during 2013 and stop sourcing altogether by 2014.
Most current capacity (nearly 70%) is said to be allocated to Apple’s products. The iPhone, iPad and iPod touch consumed an estimated 226 million processors in 2012. That demand is expected to increase but it will increasingly to be met by other suppliers in 2013. However, Samsung’s own products will take up some of the slack.
The following graph shows the estimated production schedule by customer.
There are several questions that this data raises:
I think we’re about to find out to what degree that will happen.
Digitimes Research published an estimate of the allocation of production of application processors by Samsung. It suggests that Apple will transition away from Samsung as a processor supplier during 2013 and stop sourcing altogether by 2014.
Most current capacity (nearly 70%) is said to be allocated to Apple’s products. The iPhone, iPad and iPod touch consumed an estimated 226 million processors in 2012. That demand is expected to increase but it will increasingly to be met by other suppliers in 2013. However, Samsung’s own products will take up some of the slack.
The following graph shows the estimated production schedule by customer.
There are several questions that this data raises:
- Does Samsung’s microprocessor production exceed that of Intel?
- Who will produce Apple’s processors after 2013. Will it be one or more suppliers is also an open question.
- Is Apple’s CapEx (est. $10 billion/yr.) being spent on some of this future capacity? A modern fab costs about that much.
- As the iOS processors are Apple’s own designs, will Apple be integrating production and design?
I think we’re about to find out to what degree that will happen.
Tablet Market Update: December 2012
Tablet Market Update: December 2012:
This holiday season has a high likelihood of being the biggest ever when it comes to tablet sales, as multiple manufacturers have unveiled highly publicized new devices over the past few months. To provide a view of the current market environment, Chitika Insights conducted a study focusing on tablet usage in North America.
To quantify this latest report, Chitika Insights examined a sample of tens of millions of tablet impressions from the Chitika Ad network. This study was drawn from a date range of December 8th to December 14th 2012, and only includes traffic from the U.S. and Canada.
As seen in the above graph, users of the Kindle Fire family of tablets constituted 4.88 impressions per 100 iPad impressions in December – a 4.25% share of all tablet Web traffic as a whole. This is an increase of nearly 20% from Kindle Fire’s 3.57% share observed in our last Tablet market update.
The Samsung Galaxy family of tablets also experienced a usage share increase, albeit less impressive than the Kindle Fire, growing from 2.36% to a 2.65% share of all domestic tablet traffic.
The Google Nexus family of tablets continued to see usage growth, with its share rising from 0.91% in November to 1.06% in December – an increase of more than 15%.
Despite these gains by some of the bigger players in the tablet marketplace, there has been a negligible impact to Apple’s dominant usage share. Users of Apple’s tablets still generate over 87% of U.S. and Canadian tablet Web traffic, coming down from just over 88% one month ago.
We’ll be revisiting the evolution of tablet market shortly, as the new influx of activated tablets from the Christmas holiday begin to impact usage figures.
Windows 8 Represents 2.3% of Windows Traffic Nearly Two Months Following Debut
Windows 8 Represents 2.3% of Windows Traffic Nearly Two Months Following Debut:
Available on both desktops and tablets, Windows 8 is Microsoft’s first major attempt to develop an operating system (OS) which integrates many features of the mobile experience. These range from user interface (UI) elements, to taking advantage of new hardware, and technologies such as USB 3.0 and near field communications (NFC).
Four days after its release, Microsoft CEO Steve Ballmer said that the company had sold 4 million copies of Windows 8 since the OS debuted.
On November 27th, Microsoft announced the sale of 40 Million Windows 8 licenses just one month after the release of the OS. These sales figures put Windows 8 on par with Windows 7’s one month sales estimates, according to a report by the Wall Street Journal.
However, while Windows 7 was widely adopted for commercial use, following the legacy of Windows XP, the touch-friendly, split UI nature of Windows 8 represents a challenge for businesses whose employees are very familiar with the traditional Windows UI.
In order to provide a clear picture into the level of success seen by Windows 8, Chitika Insights conducted a research study analyzing the new OS’ share of Windows-based Web traffic since launch.
To quantify this study, Chitika Insights examined a sample of hundreds of millions of Windows impressions from the Chitika Ad Network. This data was drawn from a date range of October 15th to December 13th, and focuses on impressions from the U.S. and Canada only.
Based on the graph above, Web traffic from Windows 8 users constituted 2.3% of all Windows traffic as of December 13th 2012 – exactly 48 days after its release. In comparison, 48 hours following Apple’s release of Mac OS X Mountain Lion, its new OS had already captured 3.2% of Mac Web usage. Both Windows 8 and Mountain Lion were available as downloadable upgrades to consumers for $40 and $20, respectively.
The graph above shows Windows 8 Web traffic share peaking in early December, 2012. Since then, Windows 8 activity has largely remained flat, with the most recent share figures showing approximately 2.3% of Windows-based Web traffic coming from Windows 8 users.
Nielsen Tops of 2012: Digital
Nielsen Tops of 2012: Digital:
Smartphone owners became the majority of mobile phone users for the first time this year, growing from 49 percent of mobile subscribers in Q1 2012, to 56 percent by Q3 2012. Mobile app usage also continued to grow. Among the top 10 mobile apps, Twitter was the fastest growing Android app, and the Facebook Messenger app grew the most among iPhone apps.
Google remained the top Web brand, with an average 172 million unique visitors each month between January and October 2012, followed by Facebook, which garnered an average of 153 million visits each month. Online video continued to grow in 2012, but YouTube remained the top online video source, averaging 132 million unique viewers during the year.
Rank | Site | Avg # of Unique Visitors per Month |
---|---|---|
1 | 172,649,000 | |
2 | 152,996,000 | |
3 | Yahoo! | 141,579,000 |
4 | YouTube | 128,341,000 |
5 | MSN/WindowsLive/Bing | 127,822,000 |
6 | Microsoft | 92,764,000 |
7 | AOL Media Network | 86,638,000 |
8 | Amazon | 78,128,000 |
9 | Wikipedia | 76,031,000 |
10 | Ask Search Network | 73,361,000 |
Source: Nielsen. Data from January 2012 – October 2012 (Total). Ranked on average monthly unique audience.Read as: During 2012, 172.6 million people, on average, visited Google. |
Rank | Site | Avg # of Unique Viewers per month | Avg # of Streams per month |
---|---|---|---|
1 | YouTube | 132,468,000 | 15,004,387,000 |
2 | Yahoo! | 39,725,000 | 354,024,000 |
3 | VEVO | 37,714,000 | 547,615,000 |
4 | AOL Media Network | 24,563,000 | 446,363,000 |
5 | 23,910,000 | 111,737,000 | |
6 | MSN/WindowsLive/Bing | 22,601,000 | 215,803,000 |
7 | The CollegeHumor Network | 20,164,000 | 72,519,000 |
8 | Hulu | 14,627,000 | 832,515,000 |
9 | ESPN Digital Network | 13,081,000 | 245,667,000 |
10 | Perform Group | 11,554,000 | 71,396,000 |
Source: Nielsen. Data from January 2012 – October 2012 (Total). Ranked on average monthly unique viewers.Read as: During 2012 132.5 million people, on average, streamed video from YouTube each month. |
Rank | Apps | Avg Unique Users | YTD Change % |
---|---|---|---|
1 | Google Search | 46,386,000 | 54% |
2 | Gmail | 44,516,000 | 45% |
3 | 42,379,000 | 48% | |
4 | Google Maps | 41,976,000 | 41% |
5 | YouTube | 32,223,000 | 70% |
6 | Pandora Radio | 11,600,000 | 55% |
7 | 10,674,000 | 122% | |
8 | Adobe Reader | 10,354,000 | 64% |
9 | Advanced Task Killer | 9,569,000 | -11% |
10 | The Weather Channel | 8,983,000 | 59% |
Source: Nielsen, Data from January – October 2012 (Android only). Ranked on average monthly unique users.Read as: During 2012 46 million Android smartphone owners used the Google Search app on average each month, growing their unique users 54% between January and October 2012. |
Rank | Apps | Avg Unique Users | YTD Change % |
---|---|---|---|
1 | Maps | 32,365,000 | 23% |
2 | 28,585,000 | 51% | |
3 | YouTube | 22,626,000 | -4% |
4 | Stocks | 21,080,000 | 51% |
5 | Weather | 20,531,000 | 41% |
6 | Facebook Messenger | 10,458,000 | 544% |
7 | The Weather Channel | 10,446,000 | 54% |
8 | 9,748,000 | 47% | |
9 | Pandora Radio | 9,563,000 | 47% |
10 | 6,910,000 | 197% | |
Source: Nielsen, Data from January – October 2012 (iOS only). Ranked on average monthly unique users.Read as: During 2012 28 million iPhone owners used the Facebook app on average each month, growing their unique users 51% between January and October 2012. |
Subscribe to:
Posts (Atom)