Pages

Live blogging Feed

Tuesday, April 16, 2013

Escaping PCs

Escaping PCs:
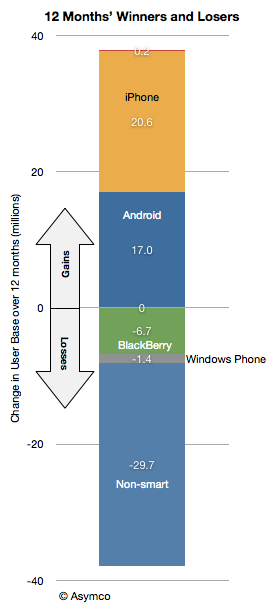
The Windows PC market is contracting. The market data has been showing unit shipment declining for some time with the latest quarter having perhaps the steepest decline for two decades.
What remains undocumented however is how the market looks when considering economic value. A more complete picture would be to show revenues, average selling price (or revenue/unit), operating margins/unit and percent of profit capture.
The data is not beyond reach however. It involves combining the shipment estimates from e.g. Gartner with financial reports from the companies themselves. Some analysis is required to estimate margins but they are also not hard to obtain (e.g. from third parties.)
So here is a view of the market for the fourth quarter 2012:
Screen Shot 2013-04-16 at 4-16-4.05.57 PM
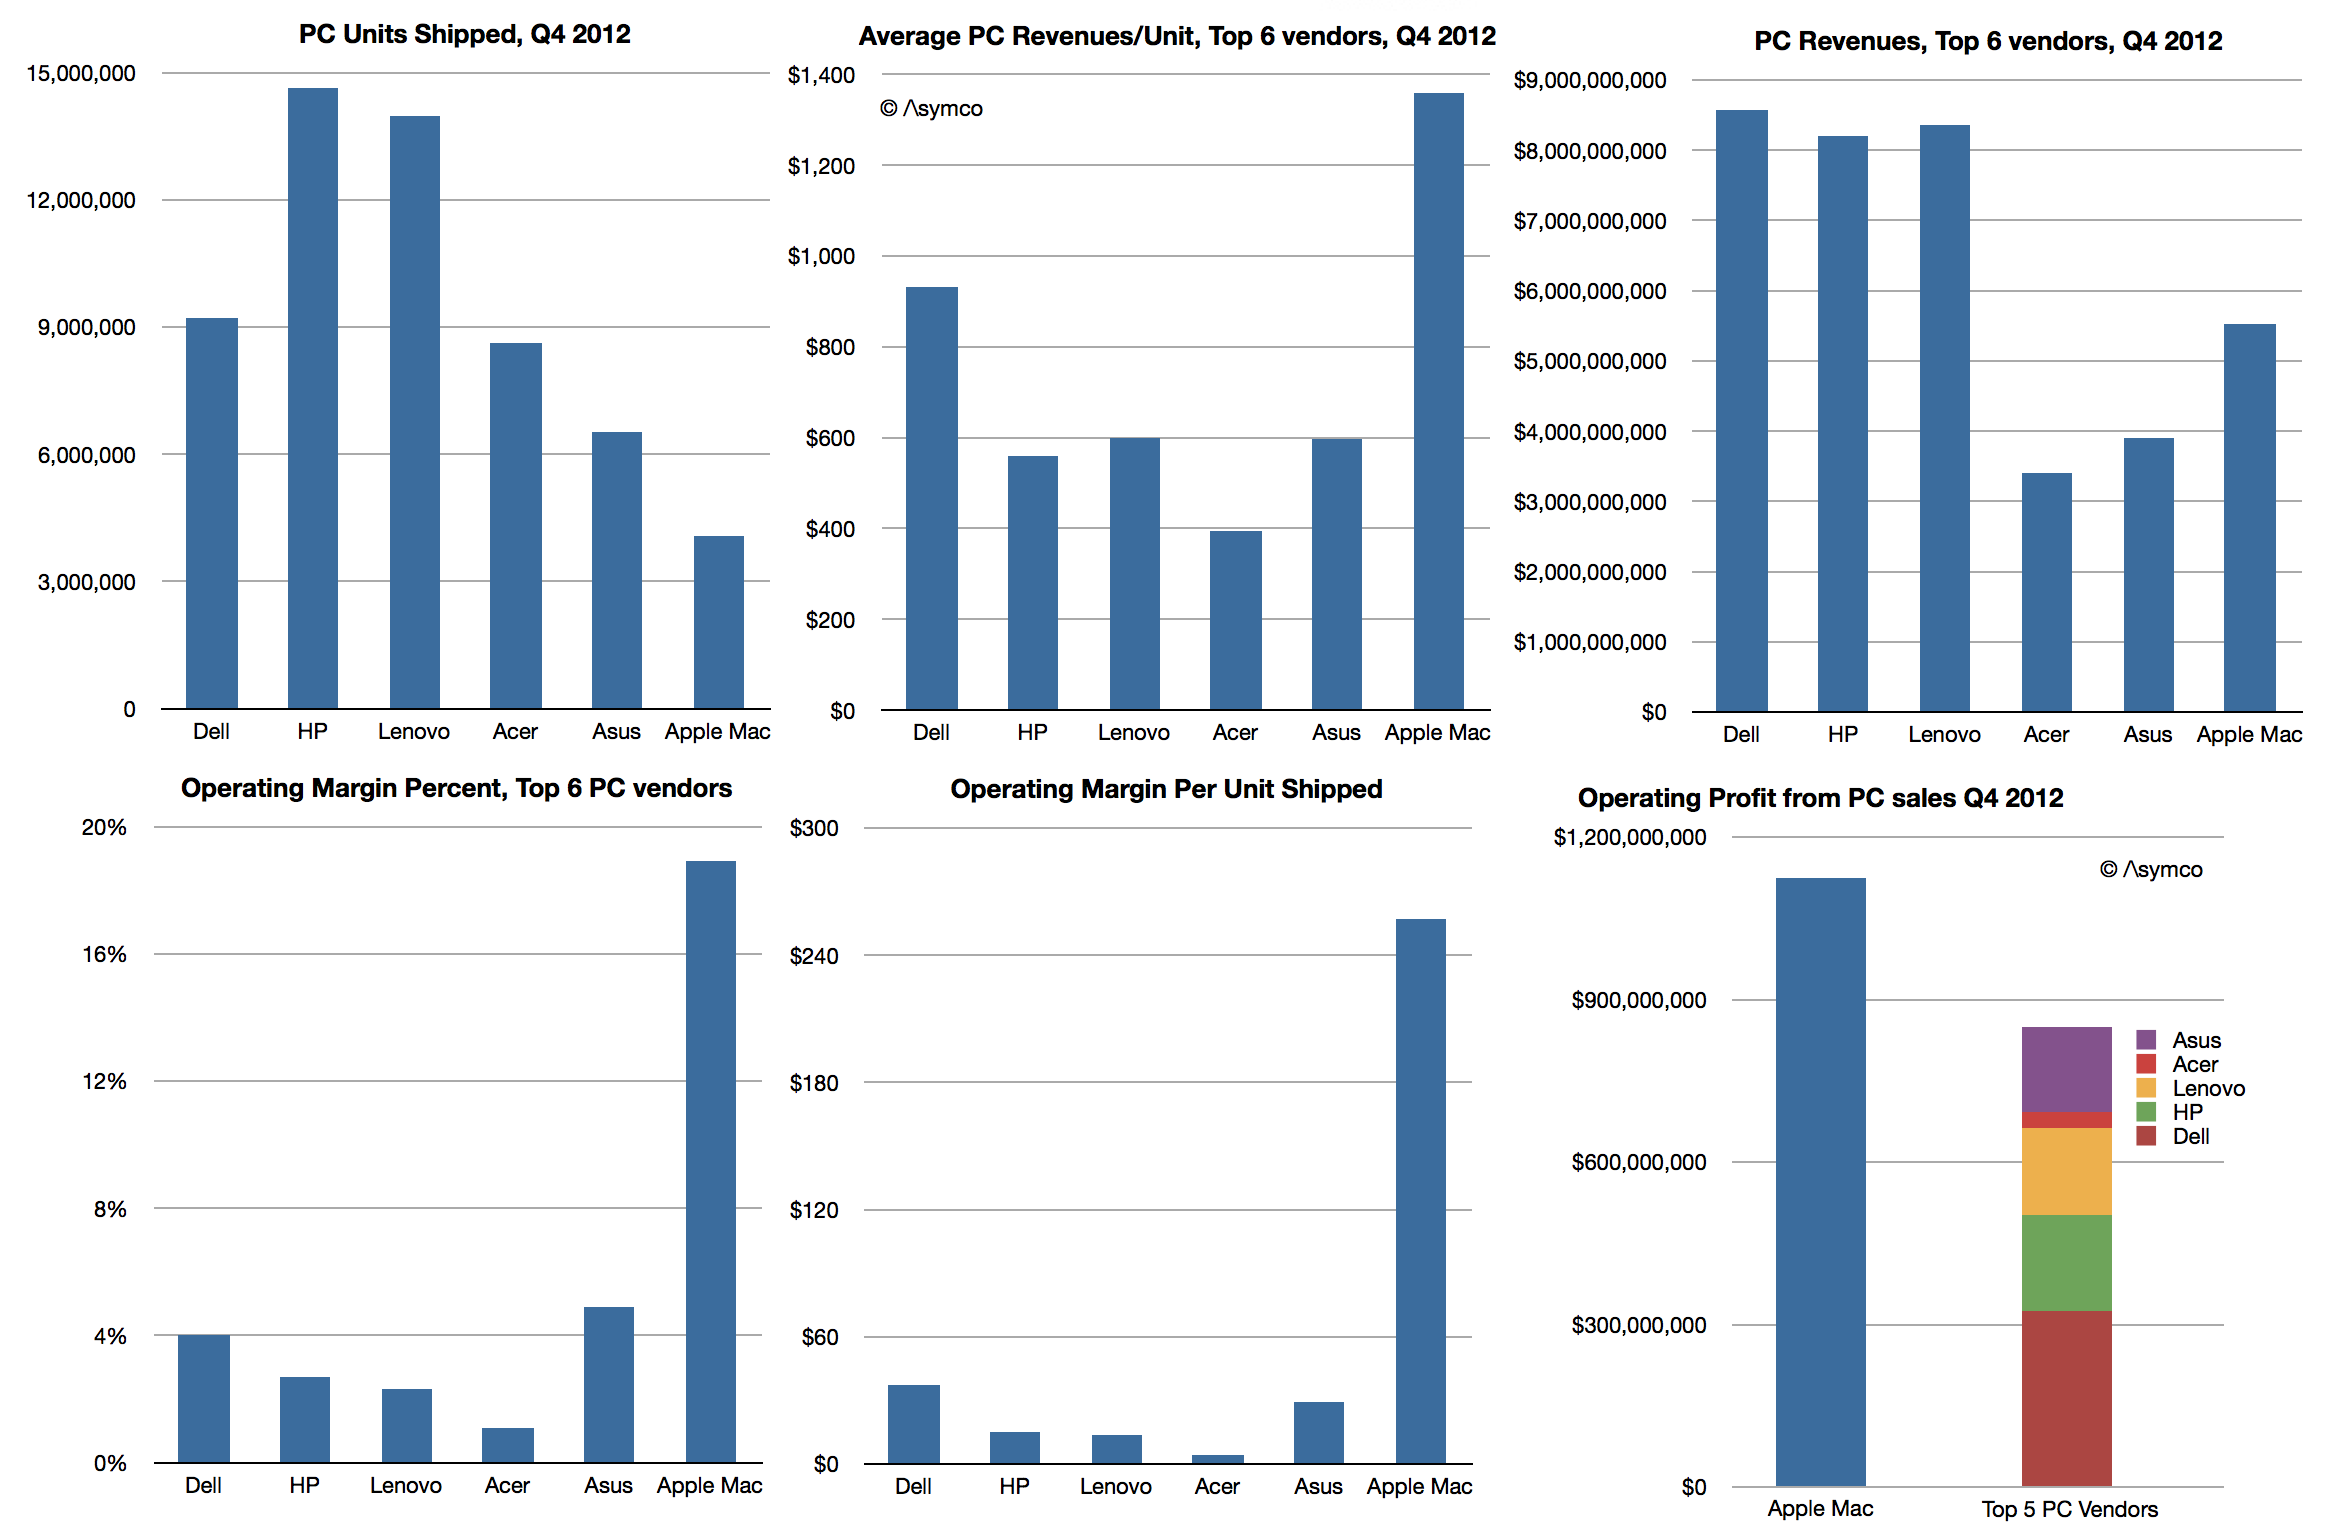
The only inference I made was with respect to Apple’s margins for the Mac. These are based on deriving a gross margin of 26% and adding an estimate of the SG&A and R&D “overhead” of 7.1% of sales, a figure which applies to the entire company. This yield an operating margin of 18.9%.
If this estimate is considered then the operating profits from PC operations imply that Apple generates more profit than all the top 5 PC vendors combined.
Assuming further that “other” vendors have the same profitability ratio as the top 5 combined yields a figure of 45% “profit capture of PC market” for Apple. This is not as good as its performance in the phone market, where Apple has about 72%, but it’s not bad.
Screen Shot 2013-04-16 at 4-16-4.16.46 PM
The real problem for the PC vendors is not that they have such low margins–they’ve had low margins for decades. It’s that the volumes which “made up for” low margins are disappearing. Apple is not immune to a gradual erosion of Mac volumes, but they have positioned themselves for growth with devices and content commerce and services. They have essentially “escaped” PCs and indeed caused the need to escape in the first place.
The problem is what could the others do? It seems all they can do is depend on Microsoft getting their strategy right.
Sounds risky.

Flurry: Android and iOS users spend 32% of their app time playing games, 20% in the browser, 18% in Facebook

Flurry: Android and iOS users spend 32% of their app time playing games, 20% in the browser, 18% in Facebook: 709528 16822578 520x245 Flurry: Android and iOS users spend 32% of their app time playing games, 20% in the browser, 18% in Facebook
Android and iOS users in the US spend an average of 2 hours and 38 minutes every day using apps on smartphones and tablets. 20 percent of that time (or 31 minutes) is spent on the mobile Web using a browser, while 80 percent of that time (or 2 hours and 7 minutes) is spent inside other apps.
These latest figures come from mobile firm Flurry, which has helped “tens of thousands of developers” to integrate its analytics and ad platforms into their apps. The company regularly offers up interesting analysis in the mobile space thanks to the more than 300,000 apps it measures usage on, across more than 1 billion monthly active devices (smartphones and tablets).
Here are the latest results:
TimeSpent App vBrowserCats resized 600 Flurry: Android and iOS users spend 32% of their app time playing games, 20% in the browser, 18% in Facebook
As you can see, the games category is by far the highest at 32 percent. It even surpasses the browser app category, which has 20 percent broken down as follows: 12 percent in Safari, 4 percent in Android, and 2 percent in Opera mini. Interestingly, Chrome and Firefox still aren’t big enough to be broken out by themselves.
It’s not too surprising that Facebook has such a large share; we’ve gotten used to this fact, but it’s still impressive to see that mobile users spend almost as much time in the app as they do in their browser. Compare that to say, Twitter, which has some slice of the 6 percent social networking share you can see above, along with Pinterest and other similar apps.
A big reason for this, Flurry notes, is that a lot of people consume Web content from inside the Facebook app: they click on a friend’s link and view it inside Facebook’s web view rather than a native browser. In fact, Flurry makes a bold claim in its analysis: if we “consider the proportion of Facebook app usage that is within their web view (aka browser), then we can assert that Facebook has become the most adopted browser in terms of consumer time spent.”
This represents a huge opportunity for Facebook. Mind you, we already knew mobile is the key to the company’s growth, but positioning Facebook as a mobile browser that 680 million mobile users access every month, is a whole different ball game.
Flurry takes it further:
US consumers are spending almost 39 minutes per day on Facebook on average. Add to that their massive reach, their roughly billion mobile users per month and you have a sizable mobile black hole sucking up people’s time. The 30 minutes a day is a worldwide average and many people spend many more minutes on Facebook (if not hours) watching and participating in what has become the ultimate reality show in which the actors are you and your friends.
Yet at the end of the day, mobile users still love their games more than their browsers. Your best bet for building a popular app (read: one that people spend a lot of time using) is still to launch a killer game.
Top Image Credit: Alan Bridges

Monday, April 08, 2013

Flurry Five-Year Report: It’s an App World. The Web Just Lives in It

Flurry Five-Year Report: It’s an App World. The Web Just Lives in It:
Five years ago, the iPhone ushered in the era of mobile computing. Today, more than a billion consumers are “glued” to these devices and their applications, impacting nearly every aspect of their lives. For businesses, opportunities seem endless and disruption is everywhere. The list of disrupted industries is long, including communications, media and entertainment, logistics, education and healthcare, just to name a few.
The past five years at Flurry have been wildly exciting. We joined an industry just as gas was forming to ignite a Big Bang, and we’re still orienting ourselves within its rapidly expanding universe. Since early 2008, we’ve worked with tens of thousands of developers to integrate our analytics and ad platforms into their apps. Today our services have been added to more than 300,000 applications and we measure usage on more than 1 billion monthly active smart devices.
On the five-year anniversary of launching Flurry Analytics, we took some time to reflect on the industry and share some insights. First, we studied the time U.S. consumers spend between mobile apps and mobile browsers, as well as within mobile app categories. Let’s take a look.
TimeSpent App vBrowserCats resized 600
Today, the U.S. consumer spends an average of 2 hours and 38 minutes per day on smartphones and tablets. 80% of that time (2 hours and 7 minutes) is spent inside apps and 20% (31 minutes) is spent on the mobile web. Studying the chart shows that apps (and Facebook) are commanding a meaningful amount of consumers' time. All mobile browsers combined, which we now consider apps, control 20% of consumers' time. Gaming apps remain the largest category of all apps with 32% of time spent. Facebook is second with 18%, and Safari is 3rd with 12% Worth noting is that a lot of people are consuming web content from inside the Facebook app. For example, when a Facebook user clicks on a friend’s link or article, that content is shown inside its web view without launching a native web browser (e.g., Safari, Android or Chrome), which keeps the user in the app. So if we return to the chart and consider the proportion of Facebook app usage that is within their web view (aka browser), then we can assert that Facebook has become the most adopted browser in terms of consumer time spent.

The App World

Five years into its existence, the app economy is thriving, with The Wall Street Journal recently estimating annual revenue of $25 billion. Once again, we have to appreciate that this economy did not exist until 2008. As we looked for possible signs of slowing, we could not find any, largely due to the fast adoption of tablets just after smartphones.
In fact, not only is the installed base of devices growing, but also the number of apps consumers use.  Our next insight comes from studying how many apps the average consumer launches each day. For this snapshot, we compared three years of worldwide data, taking the 4th quarters of 2010, 2011 and 2012.
AppsLaunchedPerDay resized 600
From left to right, we see that the average number of apps launched per day by consumers climbs from 7.2 in 2010 to 7.5 in 2011 and finally to 7.9 in 2012. This is not a material change, which is a good thing. To us, the steady growth rate indicates that the app economy is not yet experiencing saturation, as consumers steadily use more apps over time. And while there are more apps in the store, large numbers of them have short lifespans, such as books, shows and games. Assertions that people are using fewer apps in 2012 than they did in 2010 appear to be incorrect. While one could observe that consumers use only 8 apps per day among the million+ available between the AppStore and Google Play, one also needs to remember that the 8 apps each consumer uses varies widely. This creates a marketplace that can support diversified apps.
Finally, we studied a sample of more than 2.2 million devices that have been active for more than 2 years to understand the mix of new versus existing apps people use over time. To do so, we compared Q4 2012 to Q4 2010.
New vSame AppUsage resized 600
The chart above shows that, on average, only 17% of the apps used in Q4 2010 were in use earlier in the year on a device compared to 37% in Q4 2012. That means that 63% of the apps used in Q4 2012 were new, and most likely not even developed in 2011 (or possibly poorly adopted). We believe that with consumers continuing to try so many new apps, the app market is still in early stages and there remains room for innovation as well as breakthrough new applications.

The Web World

Looking again at the first chart in this study, while also considering the latest numbers from IDC, which projects that tablets will outsell desktops this year and notebooks next year, we draw the conclusion that the web, as we know it, is already facing a serious challenge. Does this mean the web is dead? We don’t believe so. On the contrary, we believe that the web will change and adapt to the reality of smartphones and tablets. Websites will look and behave more like apps. Websites will be optimized for user experience first and search engine optimization second. This supports the trend of mobile first and web second, which brings both mobile app and user experience design to the mobile web. Simply compare Target’s app on iPhone to its mobile web site (target.com) accessed from the iPhone. The mobile web site looks and behaves similarly to the Target app, albeit a little bit slower.

… and Facebook

Continuing to think about the first chart, it appears that mobile, once perceived as Facebook’s Achilles' heel, has become Facebook’s biggest opportunity. Consumers are spending an average of nearly 30 minutes per day on Facebook. Add to that Facebook's massive reach, as well as their roughly billion mobile users per month and you have a sizable mobile black hole sucking up peoples' time. The 30 minutes a day is a worldwide average which means a large group spends even more time on Facebook (possibly hours) watching and participating in what has become the ultimate reality show in which the actors are you and your friends.
The disruptive force of the mobile app economy has created opportunities, rising stars, instant millionaires, dinosaurs and plenty of confusion. However, one undeniable truth is that tablets and smartphones are eating up desktops, and notebooks and apps (including the Facebook app) are eating up the web and peoples’ time. 


The cost of building Galaxies (and iPhones)

The cost of building Galaxies (and iPhones):
Although Samsung and Apple are acclaimed as the leaders in profit capture for smart (and otherwise) phones, what is not lauded is how much they spend on capital equipment used in the making of these phones.
In 2012 Samsung spent around $20 billion while Apple spent about $10 billion (excluding leasehold improvements or Apple stores but including real estate).
Compare these figures with Intel at $11 billion, Google at $3.2 billion, Microsoft about $2.8 billion and Amazon $3.8 billion (including presumably new distribution centers.)
Screen Shot 2013-04-04 at 4-4-5.51.15 PM
What each company spends on differs depending on its business model, but as the graph above shows it’s easy to see that there is a class of “big spenders” who spend so much that it makes it hard to imagine just what $10 billion/yr could actually buy.
To get an idea of just how big that figure is consider that a Nimitz class aircraft carrier costs about $4.5 billion to build and it takes several years to do it. Or consider that the largest data center in the world probably costs about $1 billion or that the largest office building will cost between $4 and $5 billion. Either of these infrastructure projects are massive multi-year projects. Apple, Intel and Samsung spend well more than this every six months.
So it’s a special class of equipment which falls in the multi-billion dollar range: semiconductor process equipment.
Whereas in the case of Intel it’s the obvious target for the funds, how can we assume it’s the case for Apple and Samsung.
We don’t have proof but there is a remarkable correlation between CapEx and Semiconductors in Samsung’s divisional financial reports:
Screen Shot 2013-04-04 at 4-4-5.58.22 PM
We also have the historically reported allocation of CapEx as reported prior to 2008:
Screen Shot 2013-04-04 at 4-4-6.00.26 PM

Therefore I consider it safe to assume that the bulk of Samsung’s Capital Expenditures are in support of semiconductor production (note that this does not include display panels).
Note however that in the first graph, Samsung’s expenditures seem to be declining. Measured in Won, the level in Q4 ’12 was about the same as that in Q1 2010 and down 30% y/y. Apple’s spending also dropped sequentially in Q4 but was up 75% y/y. It’s also nearly ten times higher than what Apple spent in Q1 2010.
So the question I would ask is whether Samsung’s reduction CapEx (which is safely assumed to be supporting semiconductor production, and which, in turn, is, to a large degree, supporting Apple) is being picked up by Apple.
If so then then this would be evidence of the re-alignment of role and control in the value chain of a terribly important industry.

Android Version History: A Visual Timeline

Reasons for iOS outperformance in the US

Reasons for iOS outperformance in the US:
The comScore mobiLens survey for the US ending February 2013 shows continuing rapid expansion of smartphone usage in the US. Even though the 50% penetration threshold was passed seven months earlier, the rate of new smartphone users was second highest ever recorded with over 1 million new-to-smartphones users every week during February.
Screen Shot 2013-04-05 at 4-5-4.15.52 PM
Overall penetration increased to 57% with nearly 2% of the population switching in one month. Using the average growth rate for the last six periods, the US could see 80% penetration in another 19 months or by Q3/Q4 2014.
It remains to be seen if the consistency of growth which was preserved from 20% to 60% is maintained between 60% and 80%, but all indications so far are that it will be.
The growth in smartphones has been driven by the two dominant platforms: iPhone (iOS) and Android. Together they now make up 91% of the user base with about 40% for iPhone and 51% for Android.
Screen Shot 2013-04-05 at 4-5-4.19.14 PM
Android alone gained 17 million users in the last 12 months while iPhone gained 21 million users.
Screen Shot 2013-04-05 at 4-5-4.20.02 PM
iOS user gains have out-paced Android for the last four periods which resulted in a decrease in Android share of users. A reduction in Android share was also visible in the spring of last year but the current decline is not only longer but more pronounced.
Screen Shot 2013-04-05 at 4-5-4.22.13 PM
The reason iOS is growing more rapidly may be due to three factors:
  1. Broader distribution with three out of four major operators carrying the phone
  2. Availability of three product variants with $0 starting prices.
  3. Increasing awareness and use of apps and content ecosystems due to network effects.
As distribution is about to increase with T-Mobile being added to the carrier list the growth in iOS share is likely to continue even as the market expands.