Although Samsung and Apple are acclaimed as the leaders in profit capture for smart (and otherwise) phones, what is not lauded is how much they spend on capital equipment used in the making of these phones.
In 2012 Samsung spent around $20 billion while Apple spent about $10 billion (excluding leasehold improvements or Apple stores but including real estate).
Compare these figures with Intel at $11 billion, Google at $3.2 billion, Microsoft about $2.8 billion and Amazon $3.8 billion (including presumably new distribution centers.)
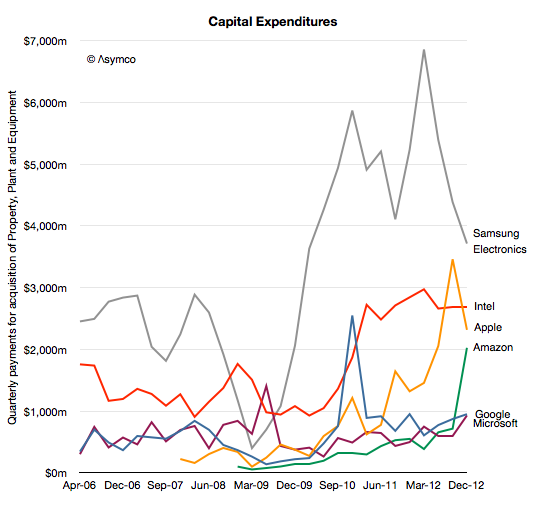
What each company spends on differs depending on its business model, but as the graph above shows it’s easy to see that there is a class of “big spenders” who spend so much that it makes it hard to imagine just what $10 billion/yr could actually buy.
To get an idea of just how big that figure is consider that a Nimitz class aircraft carrier costs about $4.5 billion to build and it takes several years to do it. Or consider that the largest data center in the world probably costs about $1 billion or that the largest office building will cost between $4 and $5 billion. Either of these infrastructure projects are massive multi-year projects. Apple, Intel and Samsung spend well more than this every six months.
So it’s a special class of equipment which falls in the multi-billion dollar range: semiconductor process equipment.
Whereas in the case of Intel it’s the obvious target for the funds, how can we assume it’s the case for Apple and Samsung.
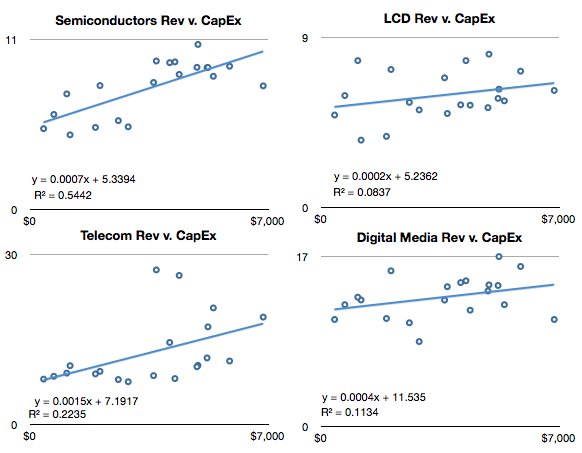
We don’t have proof but there is a remarkable correlation between CapEx and Semiconductors in Samsung’s divisional financial reports:
We also have the historically reported allocation of CapEx as reported prior to 2008:
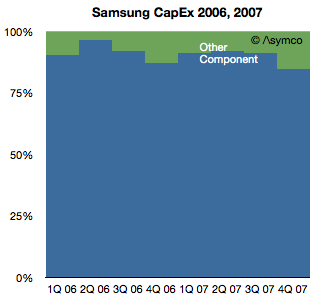
Therefore I consider it safe to assume that the bulk of Samsung’s Capital Expenditures are in support of semiconductor production (note that this does not include display panels).
Note however that in the first graph, Samsung’s expenditures seem to be declining. Measured in Won, the level in Q4 ’12 was about the same as that in Q1 2010 and down 30% y/y. Apple’s spending also dropped sequentially in Q4 but was up 75% y/y. It’s also nearly ten times higher than what Apple spent in Q1 2010.
So the question I would ask is whether Samsung’s reduction CapEx (which is safely assumed to be supporting semiconductor production, and which, in turn, is, to a large degree, supporting Apple) is being picked up by Apple.
If so then then this would be evidence of the re-alignment of role and control in the value chain of a terribly important industry.
No comments:
Post a Comment