Google occasionally reports data regarding Android. Very occasionally. The last time we had some data was in September 2012 when we learned that activations were running at 1.3 million per day and that a total of 500 million total activations had taken place.
As of today, being March 2013, the time between updates has reached five months. It’s the longest gap so far. Benedict Evans also notes that it’s been five months since the data regarding screen size stats has been updated on the Android developer site.
But we have to live with what we get and, in the absence of an update, the pattern of growth in Android, if sustained, looks like this:
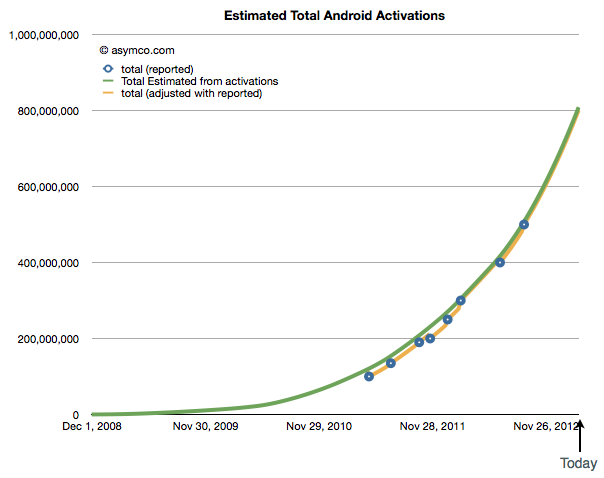
It implies that 800 million Android activations have taken place to date and the rate is about 2 million per day. One billion activations could thus happen by June.
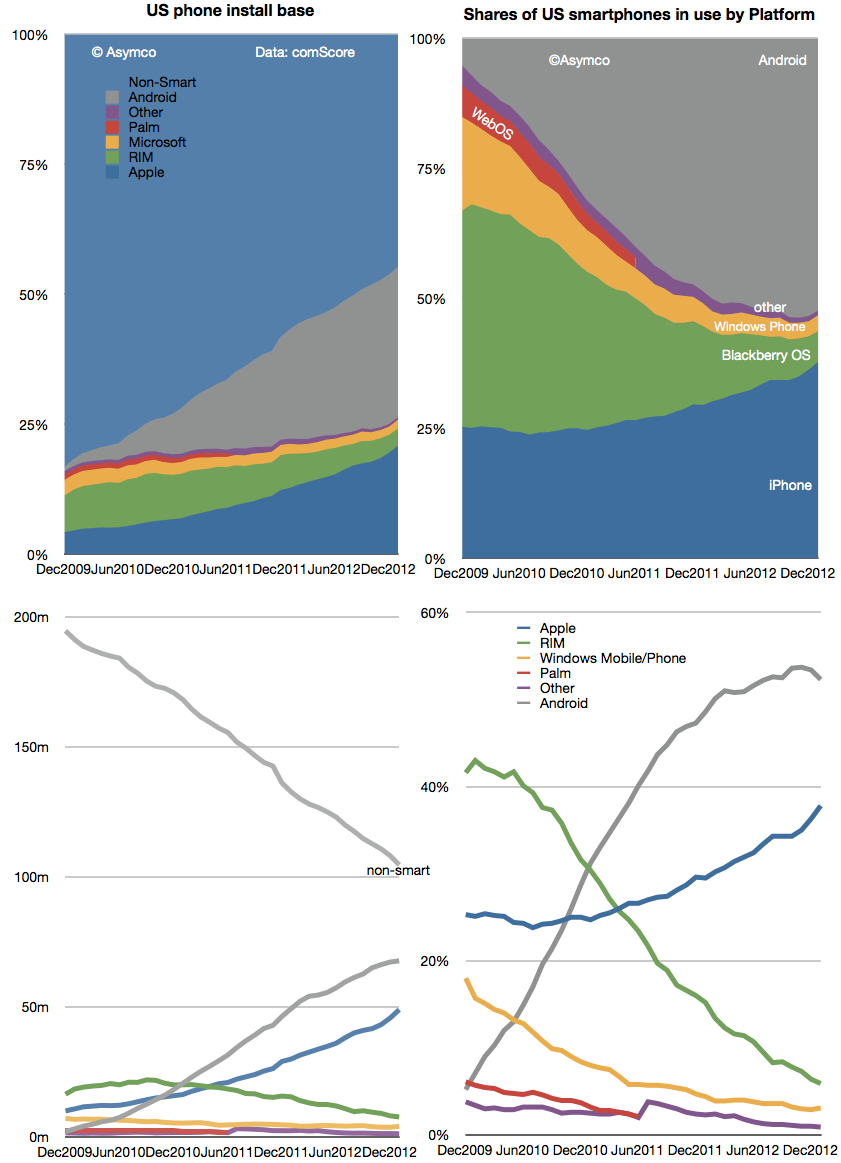
There is however another set of data regarding Android which is updated more frequently. The comScore mobiLens survey covers the US and provides updates on a monthly basis. That data shows that Android users in the US reached about 68 million as of the end of January. See the updated data below:
I included the install base and share of total users as reported. Combining the comScore data with Google’s activations gives the following picture of US as a percent of global Android (orange circles represent US base and blue circles the precent of total activations that the US might represent)[1].
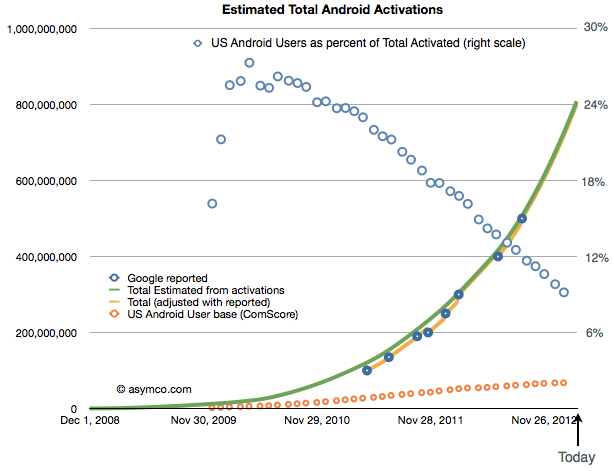
The data implies about 9% of Android usage is in the US. The more startling thing is the difference in growth: it implies that with a US growth rate of only about 13.3k/day, global growth is 150 times faster than US growth. In other words, that 0.6% of new users are in the US and that 99.4% of Android growth is outside the US.
That’s an interesting story. But it’s even more interesting that this is not the case with the iPhone. The iPhone is growing considerably faster in the US than Android. One can see this more easily with a graph of the US mobile platform net user gain rate as shown below:
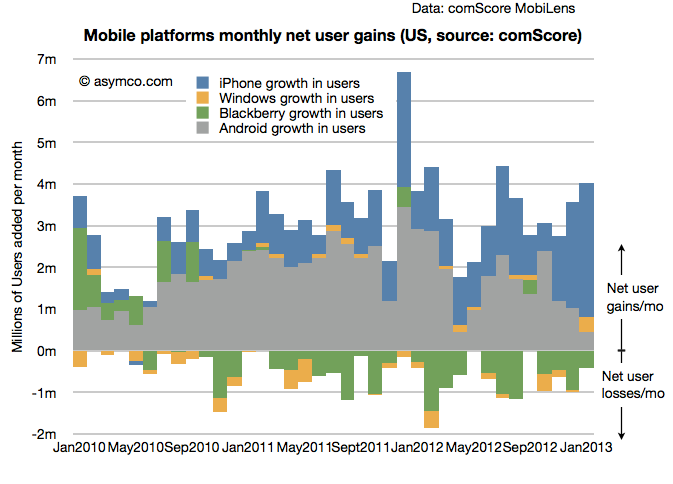
Looking at the the same contrast between global and US, from Apple’s financial reports, in the fourth quarter the global “activation rate” (i.e. sales rate) for iPhone was 525k/day (nearly one quarter of the extrapolated Android rate). The comScore data suggests the US gains are running at 106k/day. Therefore we can calculate that about 20% of iPhone growth is in the US and 80% is outside the US.
Even accounting for some potential error in the Android estimates, the contrast is quite stunning: 1% vs. 20% share of growth suggests something is very different about the US with respect to the two platforms.
My suspicion is that it has something to do with the fact that the US is one of the few (but largest) market where the iPhone is available as a “low end” offering. At a minimum price of $0 (with a contract) many consumers are finding the iPhone attractive relative to a $0 (with a contract) Android phone. This price parity (illusory as it may be) allows iPhone to grow even faster than Android in this particular market.
One wonders what would happen if such price parity were present globally.
—
Notes:
- Android activation data as reported by Google includes tablets but excludes many unofficial Android builds e.g. Amazon Kindle and many Chinese phones and tablets that don’t register with Google services. comScore data includes only primary devices used by consumers and excludes corporate purchases and devices whose primary users are younger than 13 years.