Pages

Live blogging Feed

Monday, July 18, 2011

16 of Top 20 Phones Run Android on Millenniall's Network

16 of Top 20 Phones Run Android on Millenniall's Network: "

Millennial june2011Mobile ad network Millennial Media is out with its report for June and the numbers look good for Android. 16 of the top 20 devices on the network run Google's mobile OS, keeping Android as the leading OS on the network for the 7th consecutive month. Android also accounts for a 54% impression share, says Millennial.

Top15Manufacturers


Top20MobilePhones


Apple


Millennial says that Apple is still the leading device manufacturer on its network, representing 30% of the Top 15 Manufacturers impression share. The iPhone is also still the number one phone on the network with 16% of the impression share.


iOS impressions (iPhone, iPad, iPod Touch) grew 18% quarter-over-quarter, while Android impressions grew 11%.


Samsung


Samsung grew 10% month-over-month, and is the number 2 manufacturer for the 5th consecutive month. The impression share from the Samsung Nexus S more than doubled last month, moving the phone into the #4 spot on the Mobile Phones chart.


HTC


HTC is in the #4 position on the Top Manufacturers chart, representing 10% of the impression share. The new HTC Thunderbolt showed up on the charts this month, as #19 on the Top Mobile Phones ranking.


RIM & Windows Phone 7


Both RIM & Windows Phone saw quarter-over-quarter growth in impression share, with RIM up 29% and Windows Phone up 31%.


Connected Devices


Although smartphones (65%) led feature phones and connected devices in the month's device mix, connected devices (i.e. tablets and the iPod Touch) grew 13% month-over-month to account for 18% of the impression share.


SmartphoneImpressionOSMix


Millennial also released highlights from InsightExpress' Mobile Consumer Research study, which found that consumers in Q2 2011 increasingly used tablets for activities where they had previously used other technologies like TVs, PCs or e-Readers.


27% of consumers reduced their Web-surfing on the PC, 29% checked email less frequently on the PC, 23% used their e-Reader less often, 27% watched fewer videos on the PC and 19% watched less TV after a tablet purchase.


TabletReplacementTrends


Developer Trends


For mobile app developers, Millennial reported seeing 12% quarter-over-quarter growth for iOS and 14% for Android. iOS represented 49% of the Application Platform Mix by Revenue, while Android was at 41%.


Top10MobileApplicationCategories


Games were still the top app category, with 27% of the impressions. Music & Entertainment grew 13% quarter-over-quarter and the sub-category of Music & Audio accounted for two-thirds of those impressions in Q2.


Discuss"

Smartphone Buyers Prefer iOS Over Android, BlackBerry Is Toast [SURVEY] (AAPL, GOOG, RIMM)

Smartphone Buyers Prefer iOS Over Android, BlackBerry Is Toast [SURVEY] (AAPL, GOOG, RIMM): "

A new survey from ChangeWave Research shows Apple's iOS is the most-wanted mobile operating system.


The results show 46% of people planning on buying a smartphone in the next 90 days want iOS, while 32% would prefer Android.


Then there's RIM. A pitiful 4% said they want their next phone to have BlackBerry's OS. The survey did not include Windows Phone 7.


Check out the chart to see how the demand has changed over time:


android ios rimm survey


The survey also measured user satisfaction with smartphones. ChangeWave found that 70% of iOS users were satisfied. Compare that to a 50% satisfaction rate with Android.


Here's the chart:


mobile os satisfaction survey


Don't Miss: Photos of HTC's Facebook Phone


Please follow SAI: Tools on Twitter and Facebook.

Join the conversation about this story »

See Also:


"

The Frontiers of Platform Adoption

The Frontiers of Platform Adoption: "

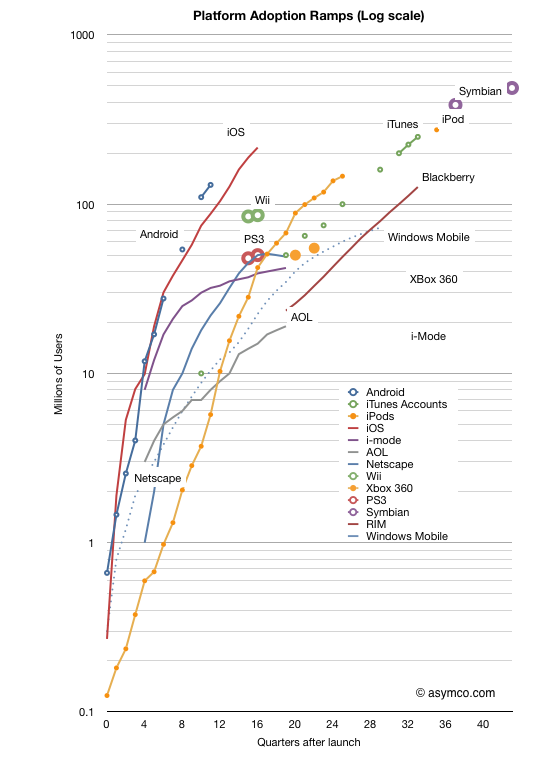
In the last two weeks we received two more data points which allow an update to the “race to a billion” platform growth trajectories. Android reached 130 million active users and iOS reached 200 million.


The updated picture looks like this:


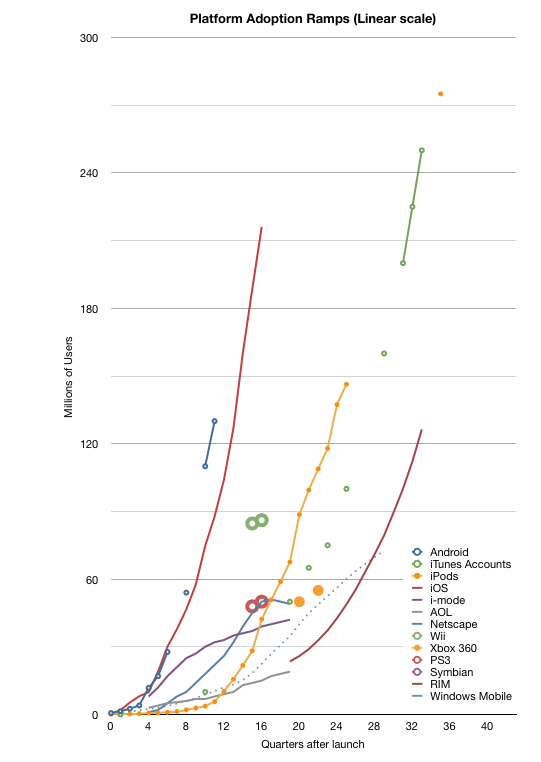
Note again that this is a log scale graph. Every major horizontal gridline is an order of magnitude (10x) larger than the one below. It’s a busy graph. The linear version follows:


For the detail-minded, it makes for some interesting comparisons, but I want to create a more compelling visualization. One where each platform can be judged for potential and impact at a glance.


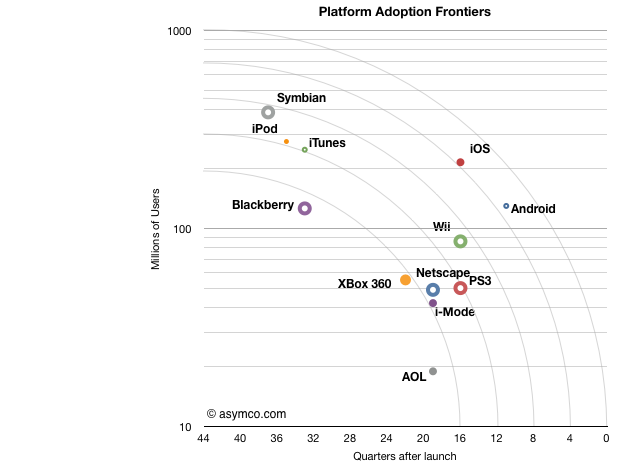
To that end I came up with something I call the platform “adoption frontier” view. Based loosely on the Pareto efficiency concept the chart is reduced to show the latest known figure of (users,time) and overlay concentric arcs centered on 10 million/10 years and radii of unit years (x-axis).


Note that the time axis is reversed from the chart above. This was to allow the best performers to be shown at the upper-right of the chart.


The way to read this is as follows:


  • Each platform is represented by a point which shows its currently known peak in users and time to reach that number of users.[1]

  • The arcs (frontiers) represent possible performance classes.

  • The lowest frontier spans “four years to reach 10 million” to “10 years to reach 200 million”. The highest frontier spans “<1 year to reach 10 million users” to “10 years to reach 1 billion users”. Each frontier can be read in a similar way.

  • The main assumption is that a platform can reach more users but it takes time. Better performance is when a platform moves toward a frontier further from the origin.[2]

  • I chose the limits of the chart specifically: 10 years is roughly the limit of most platforms[3] in the current cycle time of technology disruption; One billion users is an upper bound set by Windows.


One thing you can read from the chart is to say that “from a growth point of view, Blackberry is weaker than any of the other platforms.” Sitting below the lowest frontier with fewer users than Android which has been in the market for less than a third of the time it seems to be less impressive. It is, however, in a similar band of growth as Xbox 360, which, by some measures, is a success story. So the performance standard is relative.


One can also see the rough equivalence in growth between iPod and Symbian, both having crossed the second frontier. But iOS and Android are in a different league. They sit alone beyond the fourth frontier. The fifth frontier is the “billion user in a decade” potential and it seems within reach for both.


What this view also offers is an answer to the question of competitiveness. Although platforms can co-exist and don’t necessarily overlap, the question of becoming overwhelmed with “good enough” by widespread low end alternatives looms for the specialized platforms. For example, game consoles look very vulnerable because they simply do not have the potential to cross high frontiers and orders of magnitude of casual gamers (with potential TV connected devices) might orphan the consoles.


I’ve also included some platforms that have peaked and faded (AOL and i-Mode and Netscape) as a warning. The frontiers illustrate of how hard it is to reach the upper limits of growth. Each level is exponentially more difficult than the last and achieving it with paying customers is a remarkable story of value creation.


[UPDATE]


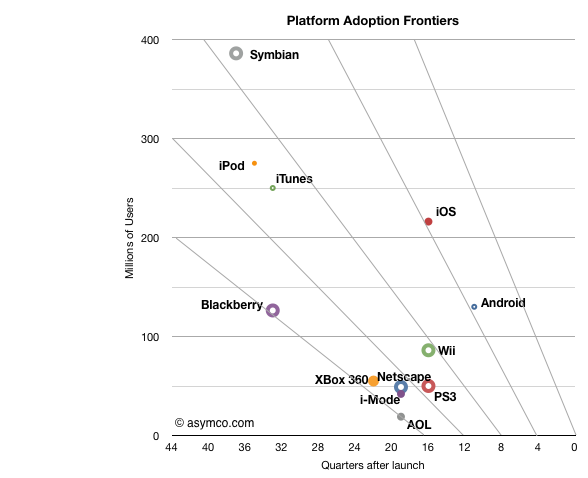
I add below the frontier chart with a linear vertical axis. Note that the frontier lines are not equivalent to the frontier arcs in terms of coverage.


Note:


  1. The data I have is for platforms where users have to pay something to participate. I exclude platforms where users are the only merchandise being sold (i.e. social networks or email provision).

  2. I only include the initial ramps not upgrades. Windows is anomalous because it is so old. During its first decade (1985 to 1995) it reached over 17 million users but placing it on this chart does not do it justice given the growth occurred in its second decade.

  3. See Symbian and Windows Mobile. However again, Windows which is nearly 30 years old, is an exception.


"

Thursday, July 14, 2011

Measuring Mobile Platform Churn in the US Market

Measuring Mobile Platform Churn in the US Market: "

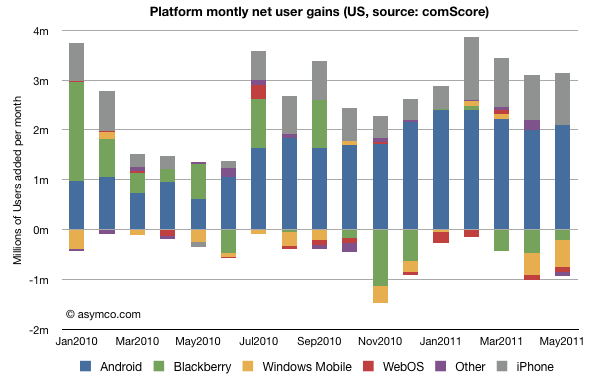
The following chart shows the net gains in users for the major mobile platforms in the US. The data is derived from comScore’s MobiLens report.


The raw numbers for the last period (ending May) are:


  1. Android gained 2.1 million users

  2. iPhone gained 1.0 million users

  3. WebOS/PalmOS lost 96k users

  4. Blackberry lost 202k users

  5. “Other” lost about 95k users


The “churn” or percent of smartphone users who switched platforms is 1.22%/month of the overall users (assuming users to left one platform moved to another rather than to non-smart devices.)


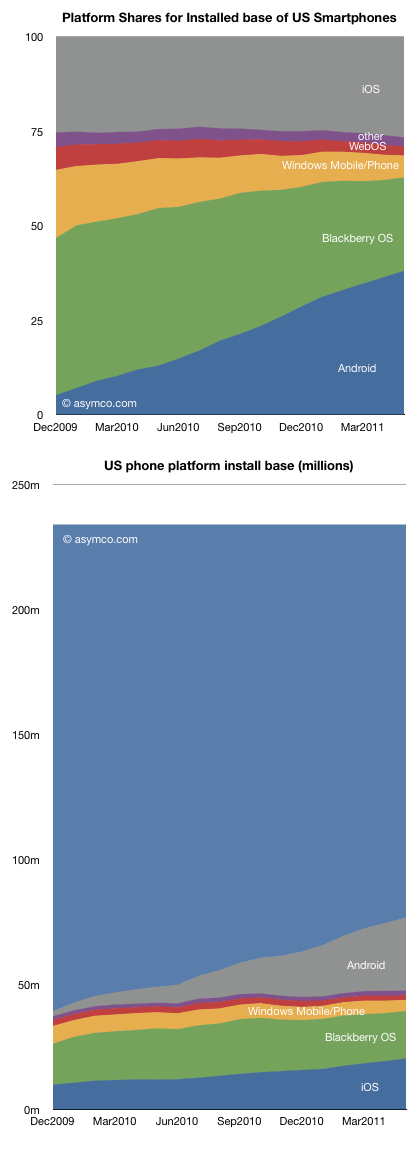
The share of the platforms and the overall composition of users is shown in the following two charts:


As usual, caution should be exercised when looking at share (top chart) outside the context of overall growth. The second chart may be more illustrative of what is happening. The light blue area on top is the smartphone non-consuming population.


Android has been a tremendous accelerant of smartphone adoption while iOS has grown as well but share has not grown significantly. iPhone growth has kept up with market growth. This cannot be said for the other platforms which have been “squeezed” between these two entrants.


So although the main competition is with non-consuming users and smartphones are winning in general, the loss of users by some of the incumbents is unsettling.


Microsoft lost just over 2 million users in the US last year while RIM lost a net of 1.5 million. Palm lost about half a million. Contrast this with 8.5 million iPhone additions and 23 million new Android users.


In particular, Windows Mobile/Phone is down to 5.8 million users (down from 18m in December 2009). With a loss of half a million per month, and share down to 4.5%, a lot is riding on the new platform.


I’ve argued that the post-PC era will be a multi-platform era. Although it may seem that the situation in the US is rapidly moving toward a duopoly, it may not end up that way. Note how much non-consumption still exists.


Note the time frame of the charts is only 18 months. The rapidity with which platforms gain ground could allow for continuing platform churn.


"

iTunes app total downloads (finally) overtook song downloads

iTunes app total downloads (finally) overtook song downloads: "

It was only a few weeks ago (at WWDC) that we had an update on the app store growth rates. The data was presented here.


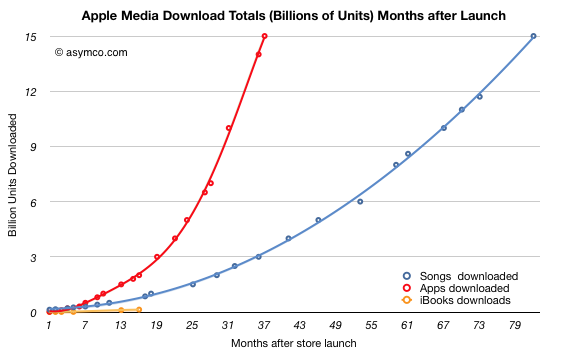
One of the data points from the event was that iTunes hit 15 billion song downloads. Last week we heard that iTunes also hit 15 billion app downloads.


The milestones were reached within less than a month so it’s a fairly safe assumption that apps have overtaken songs. I had originally guessed that the cross-over would take place at 13 billion at the end of 2010.


The actual performance is shown below (total downloads indexed to same starting date):


The 15 billion app threshold was passed within exactly three years while the 15 billion song threshold was passed in six years and 10 months. Shown on the actual time scale, the chart looks as follows:


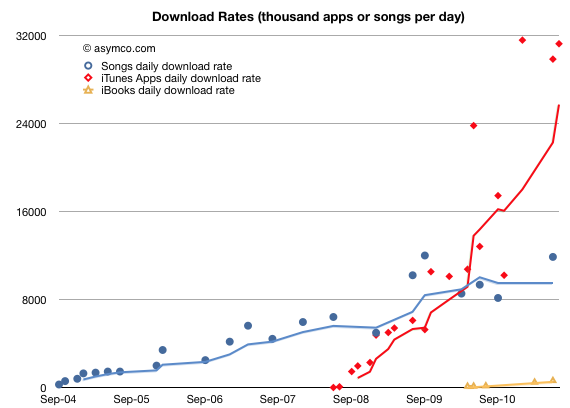
Download rates for songs had a minor rebound in the last six months.


The app download rate is now at least 31 million per month while the song download rate is about 12 million per month. Including books (but excluding video content), the App Store in now delivering at least 44 million new content downloads per month.


My prediction of cross-over was off by seven months. This was due to three factors:


  1. Song downloads increased unexpectedly. There was a rebound in the last six months where daily downloads went from about 8m/day to about 12m/day which is a new high. I had expected download rates to have peaked mid 2010.

  2. App download rates proved to be more volatile than expected. As the last chart above shows, the download rates fluctuate quite a bit. The 4-period trend line is a bit more stable, but there are kinks.

  3. Polynomial curve fitting is always sensitive.


When dealing with polynomial growth, predictions can be very dangerous. Nevertheless, I think the overall performance of the App Store is phenomenal.


"

Is the tablet computer a new PC or post-PC?

Is the tablet computer a new PC or post-PC?: "

Steve Ballmer stated and Andy Lees confirmed that Microsoft views iPad and other tablets as “just PCs”. From a market measurement point of view Canalys agrees. IDC and Gartner don’t, calling the new devices “media tablets.”


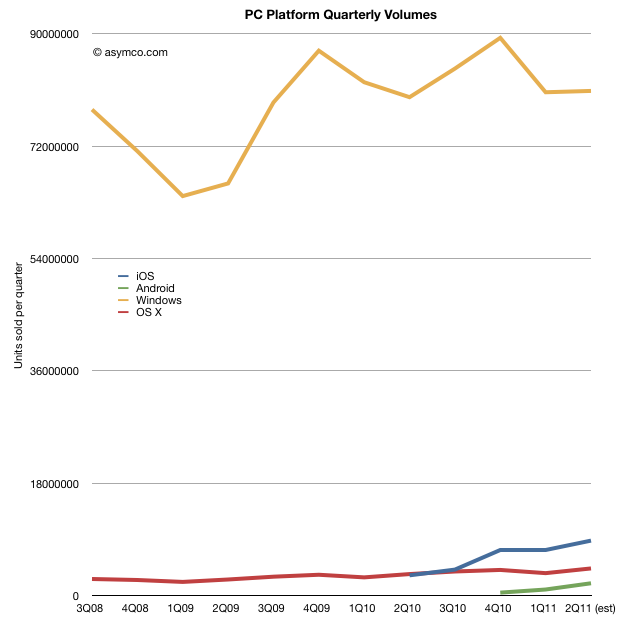
Before deciding whether tablets belong with PCs in market metrics, it would be interesting to look at what the data shows. When seen as a combined market, the focus should be on platforms. The following chart shows the four main PC+tablet platform volumes since late 2008 [1].


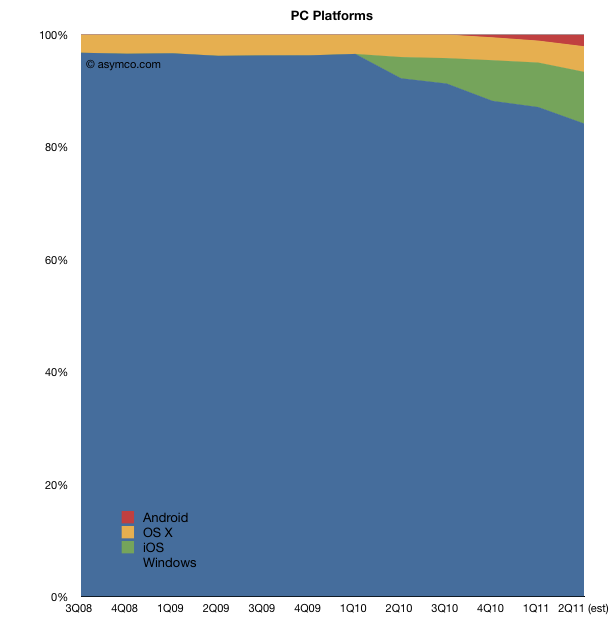
The second chart shows the same data as share of total market:


This comparison allows for some fresh observations:


  1. Excluding iPads, Apple is very close to being 5th largest global PC vendor. Global share likely to be above 5%. Including iPads, Apple would be 2nd.

  2. Platform year-on-year growth was Windows: +1.3%, OS X: +26%, iOS: +170%. Android growth cannot yet be measured since Android tablets have not been on the market for more than 1 year.

  3. In Q2 2011 one million more Windows PCs were sold than in Q2 2010. In same time, 903k more OS X PCs and 5.5 million more iPads.

  4. Excluding tablets, nearly 50% of the global PC growth was due to the Mac. Including iPad, Apple was responsible for ~70% of the growth in the PC market in Q2.


The picture that emerges is that while Windows continues to be dominant with 84% of units sold in the last quarter, the growth belongs to tablets which captured about 90% of it. If Windows remains marginal on tablets, the “PC market” will likely tip away from Microsoft in two years (depending on how quickly Apple can build iPads.)


Microsoft is making the commitment to move Windows to a tablet form factor but they are doing it while retaining the user interaction model of a desktop. This may or may not work but they are also conceding that a separate experience is also necessary. By rejecting the notion that a mobile OS alone can do the job, they are essentially building a “hybrid” tablet/laptop/desktop product which may be challenging to use but preserve their presence in the form factor.


Whether Microsoft succeeds or not will depend on whether the new form factor is disruptive in more than user experience. In other words whether this is just a “new PC” or a “post-PC”. The argument comes down to business model changes. For example the new model comes with different cycle time of product development (deep, integrated, yearly changes), different ecosystem (apps), different cost structures (high R&D in hardware), vast scale (device economics, components, ramps), and potentially new distribution (operators in the channel mix.)


Summed up, the real challenge for Microsoft is whether they can keep their business model (selling OS licenses to hardware vendors) as PCs become more device-like. Not only is iOS setting the benchmark for performance but Android is potentially ready to take share if the market turns slightly more modular. Microsoft’s differentiation looks to be primarily its legacy of PC software.


It may also seem that much remains to be discovered in this market but I think the main bets have already been made. The PC market as we know it is in the end game.


Notes:


  1. I used Gartner data for overall world-wide PC market and merged it with Mac and iPad data from Apple. Android data is estimated.


"

Thursday, July 07, 2011

State of the Global Mobile Industry – Half Yearly Assessment 2011

State of the Global Mobile Industry – Half Yearly Assessment 2011: "

http://www.chetansharma.com/globalmobileupdate1H2011.htm

Download PDF (56 pages, 3 MB)


The big picture


The global mobile industry is the most vibrant and fastest growing industry. We expect the total revenue in the industry to touch approximately $1.3 Trillion in 2011 with mobile data representing 24% of the mix. Global Mobile Data revenues are expected to eclipse $300 Billion for the first time in 2011. It is also the first year in which non-messaging data revenues will make up the majority of the overall global data revenues at 53%.


We expect the total number of subscriptions to exceed 6 billion by the end of 2011. The first 1 billion took over 20 years and this last one is going to take only 15 months. The primary growth drivers are India and China which are cumulatively adding 75M new subs every quarter. Indian and China are also entangled in the race to the billion. At the end of Q2 2011, China was ahead by 50M but India is adding subscriptions at faster rate and is likely to eclipse China before Q2 2012. By then, both nations are expected to exceed 1 Billion in total subscriptions making up 31% of the global subscriptions.


In Q1 2011, US became the first major market to exceed the 50% mark in smartphone sales. The global figure stands at approximately 26%. Some operators expect 90% of their devices sales to be smartphones by the end of the year. In terms of the actual smartphone penetration, we expect the US market to eclipse the 50% mark in 2012.


China leads in the number of subs but US dominates in both total and data revenue. A number of emerging nations are now in top 10 – Brazil, India, Russia, Indonesia, Pakistan, Mexico while once dominant – Korea, UK, Italy, Germany have dropped off or slipped in rankings.


The number of mobile operators with more than $1B in data revenues will increase to 47 in 2011. This number was only at 13 in 2005.


Japan continues to be the leader in mobile data with NTT DoCoMo, KDDI, and Softbank Japan ahead of the pack in terms of mobile data revenue and data as a % of total ARPU. In 2011, it became the first major market to have more than 50% of its mobile revenue from data services. Next, Australia and the US have made good inroads in the last two years. In fact, if we look at the overall data revenue, US is much further ahead than any nation due to the size of the market.


While India has the highest subscriber growth rate in the world right now, the revenue generating opportunity remain down right anemic compared to other major markets with average dropping down to $3.50 in overall ARPU. Even with significant subscriber base, there is going to be a general lack of opportunity in the market for the next couple of years relative to other markets.


Mobile Trends for 2011


1.Total Global Subscriptions to hit 6 Billion


–India and China racing to a billion a piece


2.Total Global Mobile Revenues to hit $1.3 Trillion, almost 2% of Global GDP


–Top 10 operators control 43% of the global mobile revenues


3.Total Global Mobile Data Revenues to eclipse $300 Billion


–Non-messaging data now owns 53% of the global mobile data revenues


4.Mobile Devices are now exceeding traditional computers in unit sales + revenue


–Majority of the device sales in the US are now smartphones. Device Replacement is shrinking


5.Mobile Broadband (4G) is being deployed at a faster rate than previous generations


–Over 1 Billion broadband connections by 2011


6.Global Mobile Apps revenue has shifted to off-deck


–The decline is directly proportional to the increase in smartphone penetration by region


7.All major markets are consolidating with the top 3 players at 85% of the market


–Regulators will have to be more prudent and proactive about managing competitiveness and growth


8.Mobile Data Traffic will be 95% of the global mobile traffic by 2015


–Many countries are facing spectrum exhaust in the next 5 years


9.Connected device segment is growing at the fastest pace


–Operators will have to quickly adapt their strategies to stay relevant in this segment


10.Several multi-billion dollar opportunity segments are emerging


–Mobile Advertising, Mobile Commerce, Mobile Wellness, Mobile Games, and Mobile Cloud Computing to name a few


11.Mobile Ecosystem has become very dynamic and unpredictable


–Apple, Google, Amazon, and Facebook have become the most important revenue generating mobile platforms


12. There will be more changes in the next 10 years than in the previous 100


– The value chains will keep disrupting every 12-24 months by the new players and business models


13. Intellectual Property has become a key component of long-term product strategy


– Top 20 control 1/3rd of the overall mobile patent pool


Devices


Apple has had the tablet space to itself. Thus far the response from the competitors has been tepid esp. on the pricing dimension. Apple has had such a mastery over the supply-chain and months ahead of the competition that by the time they figure out details, Apple already locks up the pricing advantage for the cycle. OEMs try to catch-up on the features but can’t do on the margins. OEMs can grow the pie by bringing products at a better price points that helps attract different demographics to the mix. Microsoft can make good inroads into the space with its Win8 tablet release in 2012 but it will be again in a catch-up mode as the iOS ecosystem will be even more robust by then. The cheaper Android tablets will do well in the market. As expected, tablets will pretty much eliminate the need for netbooks and are starting to eat into the desktop/laptop revenue.


Nokia and RIM are under severe market scrutiny as investors and developers leave in droves. Lack of product planning and execution has left their market share in disarray. Nokia’s valuation has been cut into half while the newcomer HTC edged past the industry giant in a remarkable story of the year. Nokia’s release of N9 shows the engineering and creative design depth but a lot is riding on the first generation of Nokia Windows Phones. While the market hasn’t shown much appetite for Windows phone thus far, a good family of devices might be able to slow the loss trajectory and position the combined team for the up-for-grabs 3rd spot in the ecosystem. HP’s acquisition of Palm is finally bringing some new products to the market but the lack of an effective ecosystem means lack of traction in 2011. Given that the computing is shifting to mobile devices, we can expect some of the weaker desktop/laptop players will exit the industry.


Tablets are primarily being used in the WiFi mode because the primary use case is indoors and WiFi gives a better (and cheaper) user experience. Once operators start to roll out user-friendly family data plans across multiple devices, we can expect the cellular activation go higher but will still be dominated by WiFi overall.


The number of connected devices per subscriber and per family will continue to increase over the course of this decade. As the cost structure and margin profile for these devices will be different, we are likely to measure performance of various operators using margin analysis for e.g. while the ARPU for connected devices is 5-10 times lower than the postpaid subscribers, the margins are typically higher due to lower costs of sales, marketing, support, and subsidy. As such the overall impact is dilutive ARPU but higher margins. So, instead of focusing on just the ARPU, the efficiency of operators will be measured in how well they maintain average margin per user (AMPU) and average margin per connection (AMPC).


Managing the data growth


As a result of the data tsunami, there are two types of opportunities that are being created, one that take advantage of the data being generated in a way that enhances the user experience and provides value and the other in technologies that help manage the traffic data that will continue to grow exponentially.


To be able to stay ahead of the demand, significant planning needs to go in to deal with the bits and bytes that are already exploding. New technical and business solutions will be needed to manage the growth and profit from the services. Relying on only one solution won’t be an effective strategy to manage rising data demand. A holistic approach to managing data traffic is needed and our analysis shows that the cost structure can be reduced by more than half if a suite of solutions are deployed vs. a single dimensional approach and thus bringing the hockey stick curves of data cost more in line with the revenues and thus preserving the margins.


The decision making process within the operator organizations will need to be streamlined as well. Operators should also consider creating a senior post which focuses on both the cost side and the solution side so they can devise and institute a sustainable long-term policy and keep the margins healthy.


Competitive landscape


The Rule of Three is evident in all major markets. While the percentage market share might vary, on an average, the top 3 control 93% of the market in an given nation. It doesn’t matter if the market is defined by “controlled regulation” like in China, Korea, and Japan or if it is “open market” driven in markets such as the US, UK, and India. Eventually, only top 3 operators control the majority of the market. There are niches that others occupy but they are largely irrelevant to the overall structure and functioning of the mobile market.


Markets such as US and India experienced similar competitive environment in their hyper-growth phase. For the US, this phase was in the nineties-mid-2000s while India has been experiencing the similar environment in the last 3-4 years. In both cases, at the start there are 5-6 players with no more than 25% market share but higher than 10% of the mix but gradually the market forces enable consolidation. Over a period of 18 years, US is settling into a “top 3” operator market. India’s brutal price wars are going to trigger the consolidation in the next 12-24 months and will eventually settle into a structure similar to other markets.


The competitive equilibrium point in the mobile industry seems to when the market shares of the top 3 are 46%:29%:18% respectively with the remaining 7% being allocated to the niche operators. To achieve some semblance of equilibrium in the market the top operator shouldn’t have more than 50% of the market share and the number three player shouldn’t have less than 20%. This helps create enough balance in the market to derive maximum value for the consumer.


Mobile operators will face some hard choices in developing and protecting the role they want to play in a given region and the ecosystem at-large. The strategy they choose will have a direct impact on the expected EBITDA margins, investment required over the long-haul, how investors view them, and on the competitive landscape of the country. Given, the fast pace of globalization, new rules and trends might emerge over the course of this decade that further define “communications” and “computing” as we know it.


Apps and Services


As expected, mobile commerce and payment discussions are dominating the ecosystem. There is clearly a lot of investment and marketing dollars being spent. However, the traditional payments networks are largely intact. The new opportunities are being built on top of the existing payment platforms with convenience (Square) and offers and advertising (Google Wallet, ISIS, Groupon). Beyond payments, mobile is getting ingrained into every vertical and every facet of our lives – from healthcare to education, from energy to entertainment, from communication to socialization. And we are in the early innings of figuring out the business models, ecosystem leaders, user behavior, regulatory needs, and the overall impact on society.


Ecosystem Dynamics


It is very clear that the ecosystem dynamics can change very quickly, one just can’t take the competitive and friendly forces for granted. In the past, the silos and segments were clearly defined with little overlap. However, over the course of last couple of years, players have been migrating and surfing in segments across the board - from Apple to Visa, from P&G to AT&T, from Facebook to Time Warner, from Google to Best Buy, every company wants to capture the mindshare and piece of the consumer’s pocketbook. The fine line between partners and competitors can get obliterated in a quarter. Apple is competing with Cisco, Comcast is going after AT&T’s business, Visa and Verizon want to be the payment channel of choice, Amazon is gunning for Microsoft’s enterprise business. One product launch, one acquisition, can change the game in an instant. And this is only the beginning.


Mobile is fundamentally reshaping how we as consumers spend from housing and healthcare to entertainment and travel, from food and drinks to communication and transportation. Mobile not only influences purchase behavior but also post purchase opinions. When the share button is literally a second away, consumers are willingly sharing more information than ever before. Mobile is thus helping close the nirvana gap for brands and advertisers who seek to connect advertising to actual transactions. The long-term battle is however for owning the context of the users. Having the best knowledge about the user to help drive the transaction is the simply the most valuable currency of commerce.


Mobile Future Forward


We will be discussing the global mobile ecosystem – the challenges and the opportunities at our annual mobile thought-leadership summit – Mobile Future Forward - brought to you in partnership with our terrific partners – Qualcomm, Millennial Media, Real Networks, AT&T Interactive, Synchronoss Technologies, OpenMarket, Ericsson, and Openwave. Hope to see you in Seattle on Sept 12th.


Some of the distinguished guests include:


Abhi Ingle, VP – Advanced Mobility, AT&T Wireless; Amit Gupta, SVP and CTO, INQMobile; Bob Gessel, VP/Head of Technology and Network Strategy, Ericsson; Braxton Woodham, Head of Engineering, AVOS; Carlos Domingo, CEO, Telefonica; Charlie Herrin, SVP - Products and Technology, Comcast; Dale Nitschke, former President, Target; Danny Bowman, President - Connected Devices, Sprint Nextel; David Messenger, EVP, Head - Online/Mobile, American Express; Erik Moreno, SVP, Fox; Gibu Thomas, SVP - Online/Mobile, Walmart; Glenn Lurie, President, AT&T Wireless; Hank Skorny, Chief Strategy Officer, Real Networks; Janet Schijns, VP, Verizon Wireless; Jason McKenzie, President, HTC-Americas; Jay Emmet, GM, OpenMarket; Jeremiah Zinn, EVP, MTV; Jerry Batt, CIO, PulteGroup; John SanGiovanni, Cofounder, Zumobi; Ken Denman, CEO, Openwave; Ken Wirth, President, Alcatel Lucent Wireless; Kris Rinne, SVP - Networks, AT&T Wireless; Mark Rolston, Chief Creative Officer, Frog Design; Matt Oommen, President, Reliance Communications; Mikael Back, VP of Products and Portfolio Management, Ericsson; Mike Mulica, President, Synchronoss Technologies; Paul Palmieri, CEO, Millennial Media; Prof. Cliff Nass, Human Computer Interaction, Stanford University; Rob Glaser, Partner, Accel; Sanjiv Ahuja, CEO, LightSquared; Stephen Bye, CTO, Sprint; Steve Mollenkopf, EVP and Group President, Qualcomm; Subba Rao, former CEO, Tata DoCoMo; Suja Chandrasekaran, CIO, Timberland; Will Hsu, Chief Product Officer, AT&T Interactive


More information at http://www.mobilefutureforward.com


Your feedback is always welcome.


Thanks and have a great 2H 2011.


Chetan Sharma


We will be keeping a close eye on the trends in the wireless data sector in our blog, twitter feeds, future research reports, and articles. The next US Wireless Data Market update will be released in Aug 2011. The next Global Wireless Market update will be issued in Jan 2012.


Disclaimer: Some of the companies mentioned in this paper are our clients.


"

Friday, July 01, 2011

In US, Smartphones Now Majority of New Cellphone Purchases

In US, Smartphones Now Majority of New Cellphone Purchases: "

Apple iOS up, Android flat, RIM down among recent acquirers.


Smartphones continue to grow in popularity. According to Nielsen’s May survey of mobile consumers in the U.S., 38 percent now own smartphones. And 55 percent of those who purchased a new handset in the past three months reported buying a smartphone instead of a feature phone, up from 34 percent just a year ago.


Android continues to be the most popular smartphone operating system, with 38 percent of smartphone consumers owning Android devices. However, while Android also leads among those who recently purchased a new smartphone, it is the Apple iPhone that has shown the most growth in recent months.


mobile-OS-sharesmartphone-marketshare

"

Monday, June 13, 2011

Getting to one billion iTunes accounts

Getting to one billion iTunes accounts: "

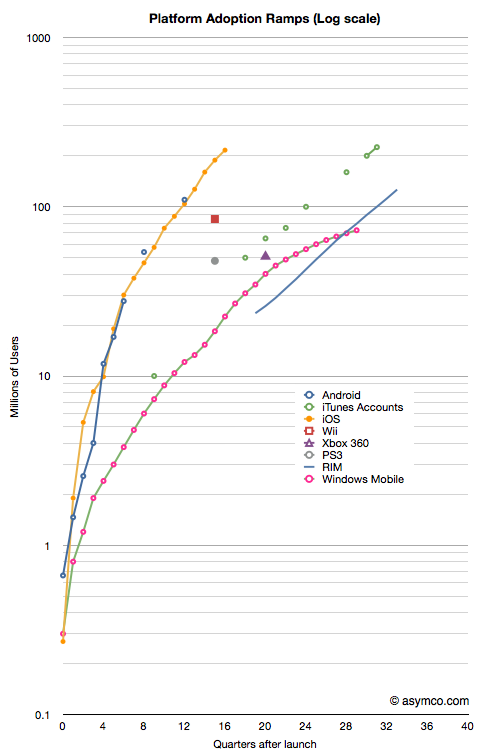
There are 225 million iTunes account holders. 25 million joined in the three months. As the iTunes store has been operating since April 2003 it’s possible to step back and look at its history and measure the rate of growth relative to other ecosystems.


The following chart shows various platforms/ecosystems in terms of adoption. In the case of phone operating systems and consoles, the cumulative units sold is shown. The scale is 10 years by 1 billion users with users measured on a logarithmic scale.


What can be easily observed is that iTunes continues to grow on a logarithmic scale even at its advanced age of 7 years. This cannot be said for console-based gaming systems or for some alternative mobile phone platforms (e.g. Windows Mobile or Symbian).


The reason for this prosperity at an advanced age may be due to the fact that iTunes has survived the transition from one device (the iPod) to a device platform (iOS). It also was able to embrace multiple media from music, to movies to TV and apps. iTunes turned out to be far more flexible and resilient given what was technologically foreseeable at its birth.


Looking to the future, is it possible that iTunes could grow in parallel with iOS toward the 1 billion user limit that the slope in the chart implies? Much will depend on gaining users who are unlikely to have credit cards and live in emerging markets. If there is one obstacle to the iEmpire it’s the addressability of markets which lack consumer credit infrastructure. I suspect, however, that these problems are not unsurmountable given that telecom infrastructure leapfrogged credit infrastructure growth with nary a ripple. Apple could certainly offer that service directly to the consumer.


"

Tuesday, April 19, 2011

First quarter PC forecast: Windows down 2%, Mac+iPad up 250%

First quarter PC forecast: Windows down 2%, Mac+iPad up 250%: "


Charles Arthur of The Guardian writes that PC sales “may have passed their peak“. That’s a powerful, concise statement. It’s backed up by a quote from Gartner’s Mikako Kitagawa:


“This was the third consecutive quarter of mobile PC shipment declines in the US”


IDC even lays part of the blame to something called “media tablets”[1]:


“While it’s tempting to blame [PC] decline completely on the growth of media tablets we believe other factors [...] played equally significant roles.”


But there are several problems with both IDC and Gartner’s analysis of the market. It’s hard to make out causality from their data. There is separation by vendor but not by operating system and there is exclusion of devices hired to do the same jobs as PCs.


For this reason, I need to do my own analysis. I retrieved Gartner’s public statements on the overall market and layered actual Mac and iPad units sold. I also added my estimates for the Q1 2011 quarter just ended to complete the picture.


We can now get an understanding of how the industry behaves with and without various platforms. The chart at the left gives the various growth rates of the market with platforms isolated from each other. I apologize for the shape of the chart but the scale does not permit a concise visual.


Including the iPad, the total PC growth is shown by the blue line. It shows that the market peaked during the recovery but is now slowing considerably.


The green line shows the PC industry excluding both the Mac and the iPad. Although it might include Linux or computers sold without an OS, the label “Windows PC” is a fairly close approximation. It shows that the market excluding Apple entered contraction this quarter and is out of sync with overall economic recovery and growth.


The red line shows the behavior of the Mac franchise. It’s well ahead of the overall market with 2x to 3x the growth. This has been a pattern for over 18 quarters. I had some thoughts on this in a November 2010 hypothesis.


But the most telling line is the orange line which includes both the Mac and the iPad. In an industry where growth is usually measured in single digits, the iPad business brings growth in three digits.


This near tripling of unit sales is symptomatic of fundamental change that cannot be ignored. Although some analysts contend that the iPad is not causal to the decline in other PC sales, teasing out platforms data seems to show a divergent view.


The bottom line is that Windows-only computer units are down 2.0% while OSX-based computer units are up 272% (this excludes both the iPhone and iPod touch).


Correlation is not causation but tests or surveys where substitution can be proven do exist. For example, a recent survey shows that 77% of users reported that their PC usage decreased after getting a tablet. It also showed that 28% considered their iPad as their primary computer.


So coupling the sales data with the usage data does point an accusatory finger for the decline on the iPad.


In addition, some vendors are being hit harder than others which also hints at where substitution is happening. For example, IDC reports that Acer US unit shipments fell 42% in the first quarter and 16% globally (Gartner’s numbers are less dramatic but in the same direction). Since Acer is known for its netbook computers it’s another telling sign of possible substitution (Acer’s own management has indicated as much.)


So the weight of evidence is beginning to be conclusive: the iPad is the new PC. It should be clear by now that the iPad moves computing into new contexts so it does not yet substitute the PC market but extends it and increases consumption. Substitution is happening in low-end grazing type of usage, a place where the PC was ill-fitting anyway. Incumbent vendors might actually be relieved that the lower margin netbook is finally being supplanted and they can concentrate on the higher end.


Notes:


  1. Analysts like to call the iPad a “media tablet” but the same AdMob survey shows media consumption to be one of its least popular uses.


"

Monday, April 18, 2011

The Android step function

The Android step function: "

There is precious little data on Android units sold. There are estimates but no actual summary. Google themselves don’t seem to know as they don’t report sales, preferring to report “activations.”


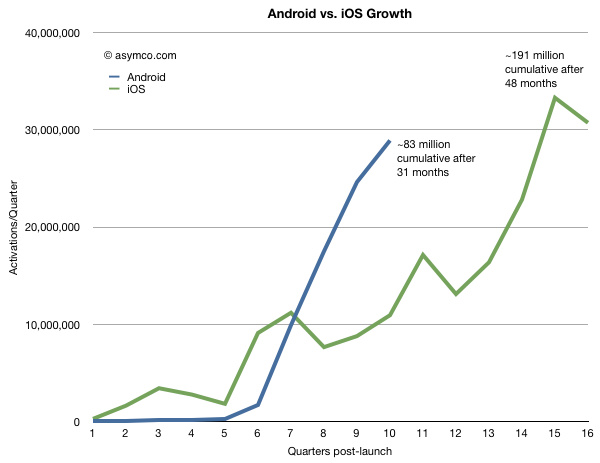
Assuming that activations means “unique activations of new devices” then we can draw some equivalency between Google’s reports and the reported units of iOS sold. There is some uncertainty with respect to iPod touch units, but that is not very big (estimates are drawn from Apple’s reporting of overall iOS units at several points in time.)


To estimate Android, I took the download rates currently available and placed them in the month when they were published. I then interpolated the data monthly and quarterly.


To make the comparison more valuable, I chose to index the starting point at the launch of each respective platform and plot quarterly units (or activations). This way we can observe how the platforms ramped in growth and where they were at similar points in their lifetimes.


The following graph results.


There is likely to be more seasonality in Android data than is shown, but the impressive thing is that Android is running at three times the equivalent adoption rate for iOS at similar points in time. In fact Android is being “sold” as rapidly as iOS today even though iOS has been in the market about 15 months longer.


Overall, cumulative units sold for iOS are still about twice as many but if Android will continue to grow as rapidly as it does now, it will likely overtake iOS in installed base in less than a year.


One should be careful about drawing conclusions that this implies effective competition. Both platforms are growing very quickly. iOS is growing at at least 100%/yr and Android’s second year was 65x bigger than its first. iOS growth is limited by the ramp rates of a limited portfolio of products. Android growth is limited by how quickly vendors can bring out products. Neither platform is demand constrained and hence they are competing for share of growth not for share of a fixed pie.


Extrapolation is a dangerous game, but the chart above shows some predictability in Apple’s curve whereas Android has a “step function” or discontinuous feel to it and that’s a curious thing.


Not so much for its lack of predictability but because it’s so asymmetric to iOS.


A dictum of classical physics states that in nature everything is continuous. However, in quantum physics everything is discontinuous. Both models of the physical universe have their uses.


It should be noted that both business models represented above can also co-exist, at least for the foreseeable future.


"

Monday, April 11, 2011

Divinely inspired analysis

Divinely inspired analysis: "

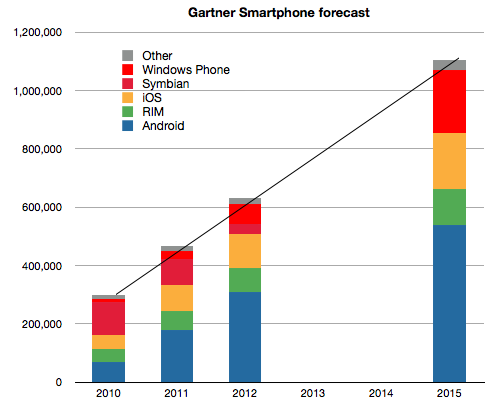
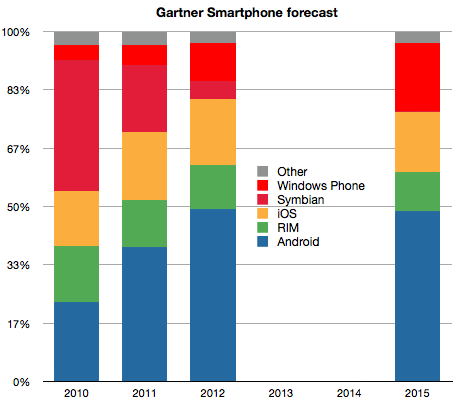
Three things stand out from Gartner’s latest smartphones forecast:


  1. They published a four year forecast with seven significant digits of precision (implying a margin of error of 0.00001%).

  2. There is a linear growth in total market size.

  3. There are no significant share changes after 2012.


The latter two claims are illustrated below:


Notwithstanding the defensibility of these claims Gartner analysts makes some further assumptions (quoted verbatim).


  1. “Apple will be interested in maintaining margins rather than pursuing market share by changing its pricing strategy”

  2. “RIM’s migration from BlackBerry OS to QNX which is expected in 2012″

  3. “Nokia will push Windows Phone well into the mid-tier of its portfolio by the end of 2012″


These assumptions may be valid, but from where I’m sitting, the first assumption contradicts Apple’s COO, the second would be an engineering marvel and the third would be an organizational miracle.


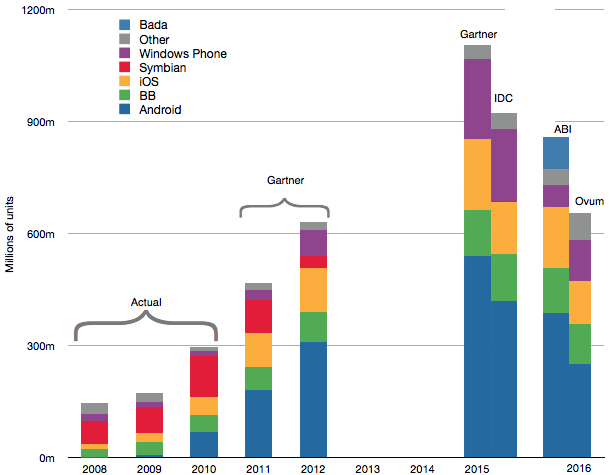
Putting together all the long term forecasts with what is already known about the market history gives the following combined forecast.


At the risk of repeating myself, the only thing I can summarize from this collective wisdom is that the over-riding assumption in forecasting seems to be that the future is an extrapolation of the present. That would indeed be a miracle.


"

Wednesday, March 23, 2011

[Infographic] Top 5 Handset OEMs 2001-2010

[Infographic] Top 5 Handset OEMs 2001-2010: "

In the past 10 years, the handset manufacturer landscape has changed dramatically.


Companies that seemed unshakable have lost ground and are gradually being replaced by new and agile contenders, borne from the PC industry. The ‘old OEM guard’ is still being driven by momentum, but as one-by-one these giants fall and smartphone adoption continues to accelerate, the battle for a spot in the top 5 leaderboard is getting more and more heated.


How has the landscape changed, you ask? Well, just take a look at our latest infographic:


Top 5 handset OEM