Pages

Live blogging Feed

Thursday, February 16, 2012

The iPhone opportunity: a visual update

The iPhone opportunity: a visual update:

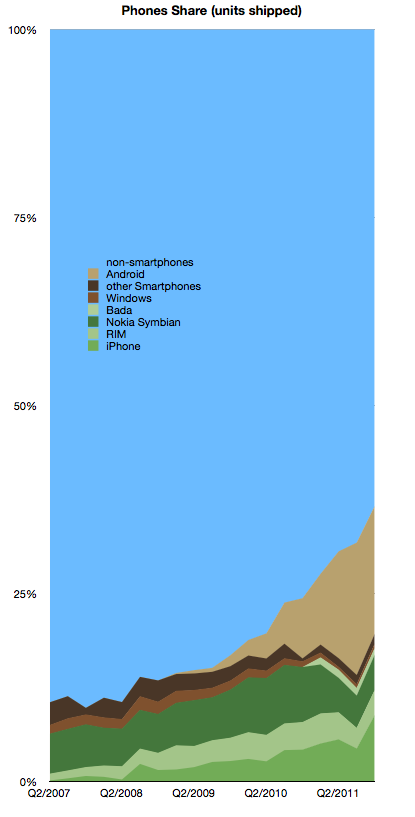
In yesterday’s talk Tim Cook described the opportunity he felt Apple faced. To readers of this blog this opportunity has been regularly illustrated, at least on a quarterly basis. Here is the iPhone opportunity relative to other platforms:


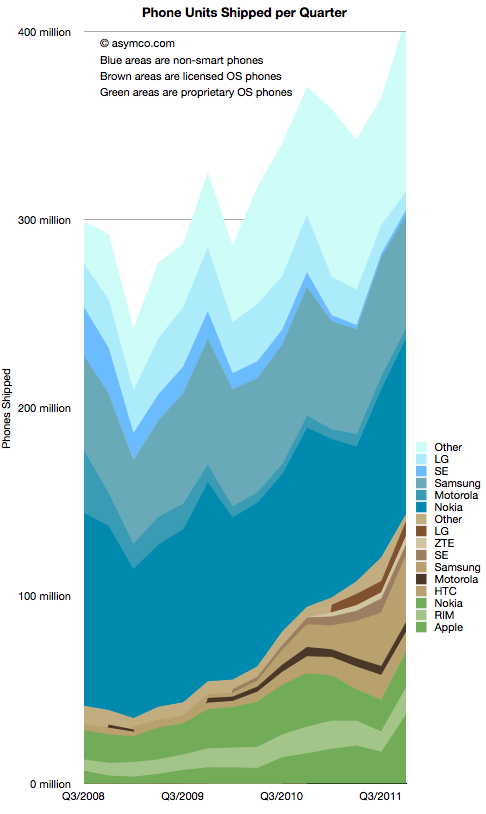
In absolute units by vendor, separated by smart and non-smart phones, the data looks like this:


The pattern of smartphone growth remains consistent even though there was a temporary dip in Q3 for the iPhone (and hence for the green-shaded proprietary OS phones.)


The Dead Platform Graveyard: Lessons Learned

The Dead Platform Graveyard: Lessons Learned:

[Besides the iOS and Android platforms grabbing the industry headlines, there is an abundance of (over 25) platforms that didn't make it. Managing Director Andreas Constantinou recounts the graveyard of dead platforms and exactly what it takes to build a successful platform today.]


VisionMobile - Dead mobile platforms


2011 turned out to be open hunting season for mobile platforms, with the MeeGo, webOS and LiMo projects coming to an end.


MeeGo, webOS and LiMo, together with Windows Mobile and Symbian are just the tip of the dead OS iceberg. The last 10 years have seen numerous companies launch operating systems or platforms for mobile devices, most of which have been fallen under the media radar.


A brief history of dead platforms


The table below lists all known mobile platforms that have died or are a ‘zombie’ (semi-dead) state – that’s all 26 of them, from Access Linux Platform to Windows Mobile. We‘ve also researched the birth and death date of each platform.


Most of these platforms have been designed as software platforms, that is, aimed at reducing costs and time-to-market for handset makers, aka OEMs. Most of the platforms were provided under a software licensing model were monetized via add-on services (e.g. IXI and Danger) or kept for in-house use (e.g. Nokia GEOS). Only post-2007 did we see applications platforms, i.e. those designed to target primarily developers and offered under a zero-royalty model. For the differences between software and applications platform see our earlier post on Platforms 101 and why not all mobile platforms are created equal.


Why are 25+ platforms dead?


In the last decade, software platforms have failed for a combination of reasons.


Cost of ownership. The cost of creating a mobile software platform should not be underestimated. Symbian was quoted as having cost over $700 million of development cost. Even for lighter platforms, a vendor is looking at a ballpark of $100 million cost over 2-3 years of initial development, plus the incremental integration cost with each new hardware platform and the long-term R&D cost to maintain the platform to a competitive level.


Conflicting revenue model. Prior to the zero-royalty model introduced by Android, all software platforms were monetized through per-unit licensing in the order of $5 to $15 per unit. This obviously represented significant costs for the OEM and also competed with bundled (free) software stacks from chipset vendors like Texas Instruments’ BMI, Qualcomm BREW, Mediatek (HOpen) and Infineon RedArrow. That was of course before the mass arrival of smartphones and the abandonment of the royalty model.


Lack of network effects. Even though Microsoft had pioneered the two-sided software platform strategy with Windows since 1995, the benefits of network effects in mobile platforms were not properly understood until the launch of the Apple App Store in 2008. It was Apple that proved how network effects – the positive feedback loop between app developers and users – can lead to enormous demand-side economies of scale. It was the power of well-oiled network effects that made Nokia realize that “it had to go to developers” (and not wait for developers to go to Nokia) before eventually losing the Symbian battle against Android and iOS.


High adoption barriers. For a handset maker, adopting a new platform is a painstaking, multi-year process. HTC is rumored to have been working with Android since 2005 and with Windows Mobile since 2000, 2-3 years before it produced the first G1 and SPV models, respectively. In addition, handset makers are very risk-averse (they have tough customer commitments to keep up to) and so have in most cases preferred to stick with their internal spaghetti platforms rather than take the risk of adopting a new one.


The ingredients of a successful platform


There are a handful of remaining software platforms today. Besides the usual suspects Android, iOS, Windows Phone and Bada, we should also consider BREW MP (still surviving), Trolltech’s Qt (an API framework acquired by Nokia in 2008 and rumoured to be soon reappearing on Nokia’s Series 40 handsets) and Smarterphone, a niche ‘smart’ operating system for feature phones recently acquired by Nokia.


The chart above makes it clear what is the success factor of modern platforms. Firstly, software DNA, that is a company with resources, processes and values routed in the PC or Internet world where developers, not OEMs are the platform’s primary customer. Secondly, a successful platform vendor needs to have large pockets due to the billions of dollars in investment needed to build a stable and advanced software foundation, while attracting developers to the platform. Note that the bubble size in the chart shows last relative size of 4 quarters of vendor revenues.


But the secret sauce is neither in DNA or money; it’s hidden in Stephen Elop’s famous burning platform memo: ”Our competitors aren’t taking our market share with devices; they are taking our market share with an entire ecosystem”


The secret sauce behind the success of iOS and Android is how thanks to network effects (the closed loop driving users to developers and developers to users) platforms have managed to generate billions of external investment, both in the form of developer investments (time/effort) and operator investments (subsidies).


It’s network effects that have created near-insurmountable barriers to entry for Microsoft who despite boasting 75,000 WP7 developers achieved only one million sales of its flagship Lumia model from its strategic partner Nokia.


And whatever Bada, Tizen or any other alphabet-soup-chef tries to conjure up, they should never forget that you can’t buy developer love. You can only plant the seeds. That’s why Facebook Platform is following exactly the right strategy: take a vibrant developer community and offer it a new addressable market.


- Andreas

follow me on Twitter for more: @andreascon


Tuesday, February 14, 2012

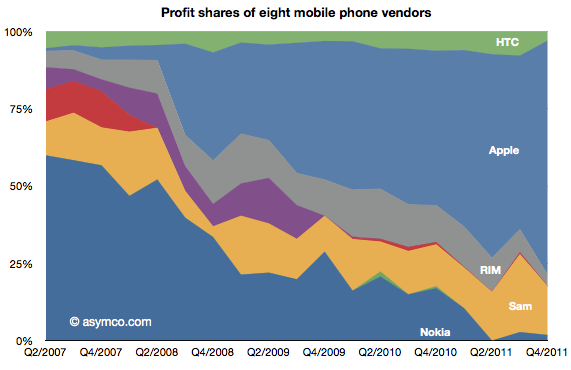
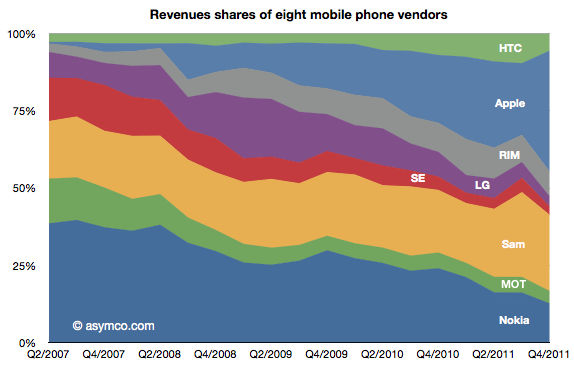
First: Apple’s rank in mobile phone profitability and revenues

First: Apple’s rank in mobile phone profitability and revenues:

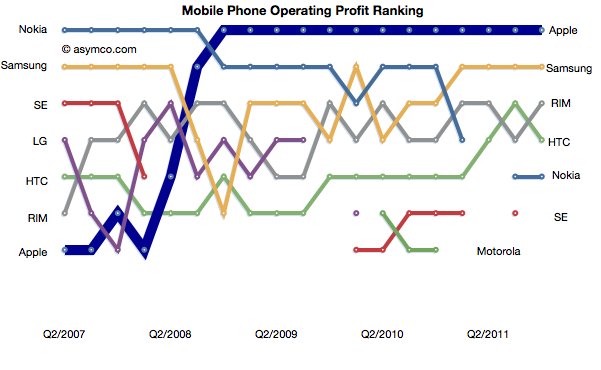
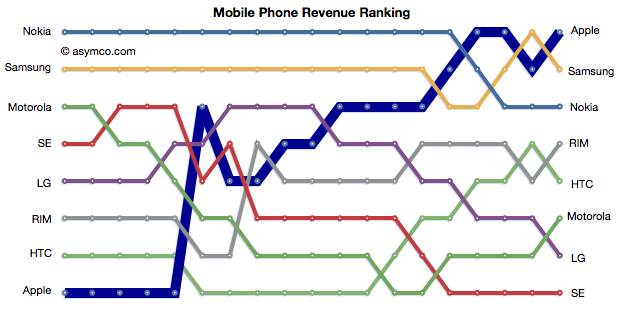
Apple retained its top rank in profitability and regained the top spot in mobile phone revenues.


The relative shares of revenues and profits are shown below:


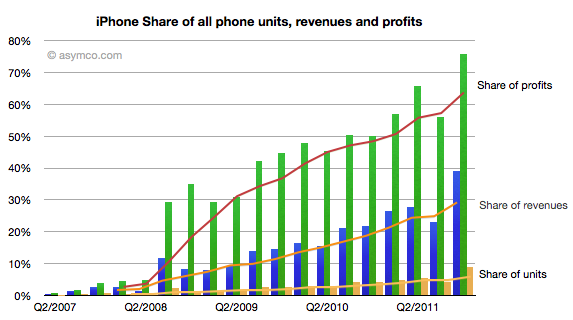
Individually, Apple’s share of units, revenues and profits is chronicled below:


Apple reached 75% of profit share, nearly 40% of revenue share and 9% of units share.


Apple and Samsung combined for about 91% of profits with RIM third at 3.7%, HTC fourth at 3.0% and Nokia last at 1.8% of a $15 billion total for the quarter.


In terms of revenues, Apple had 39% to Samsung’s 25%. Third was Nokia with 12.6% and fourth RIM at 8%. HTC only managed 5.5%, Motorola 4%, LG 3.3% and Sony Ericsson 2.7%.


The US temporarily regains relevance for Apple’s iPhone

The US temporarily regains relevance for Apple’s iPhone:

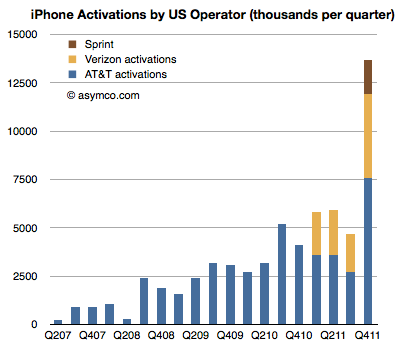
Sprint reported its first iPhone quarter sales at 1.8 million. You may recall my analysis of Sprint’s “gamble” where I estimated that Sprint will easily sell the 31 million iPhone which they committed to buy from Apple. I had estimated that they could sell an average of 7 million units a year but perhaps conservatively they could ramp at 4, 6, 9 and 12 over the four year period rumored to be in the contract.


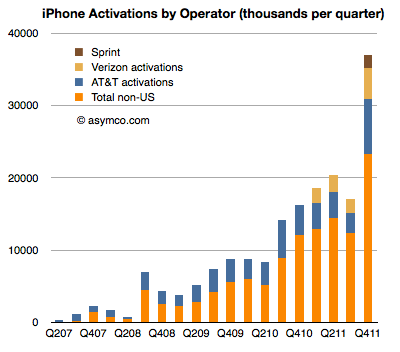
Given the pent-up demand I also estimated that the first quarter could reach 2 million units. They managed 1.8 and that’s a solid start. Overall the US carriers activated 13.7 million iPhones. Here are the iPhone activations by US Operator:


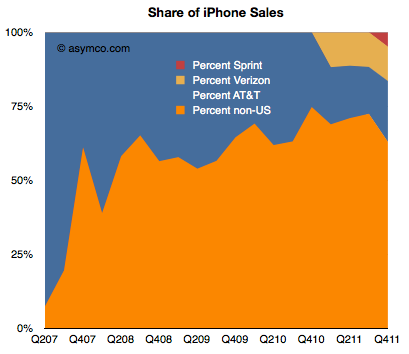
That’s 37% of the total market in Q4, shown in area and bar charts below:


Note that the percent of total activations outside the US has dropped but that is due to the limited distribution of the iPhone 4S outside the US in the launch quarter. The long-term trend is for the US to decrease as a percent of total iPhones even with the additional US distribution.


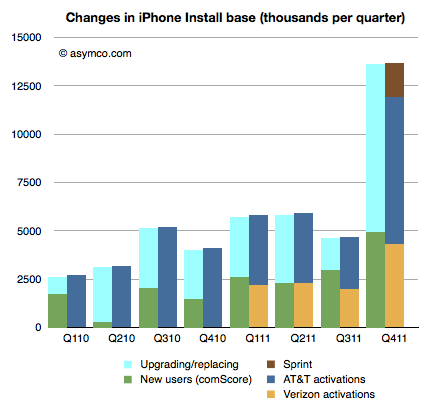
By comparing the net adds to US install base from comScore survey data, we can estimate that about 63% of US purchases of iPhones were replacements and that 8.7 million iPhones were put out of use in the US last quarter.


Google Chrome could exceed 50% market share by end of 2012 (study)

Google Chrome could exceed 50% market share by end of 2012 (study):

There’s no denying that Google Chrome continues to be the darling of the web browser market. And as we predicted in July last year, Chrome overtook Firefox around November 2011.


So now the question is, when will Google also wrestle down Internet Explorer, and become the undisputed king of the browser world? In December 2011, Chrome 15 became the most popular browser in the world, beating Internet Explorer 8, but if you combine all IE versions, Microsoft still holds the number 1 spot.


Equipped with the latest web browser statistics from StatCounter, we set out to see when Chrome is likely to achieve more than 50% market share.


Chrome is still growing, IE is still shrinking


The web browser market, spanning January 2011 to January 2012, looked like this:


The clear trend during 2011 was that IE was shedding users, as was Firefox. Chrome was gaining users, as was Safari. But with the very small market shares for Safari and Opera, the changes for those browsers aren’t really visible in the chart.


Chrome already passed Firefox in November last year, just as our prediction from July 2011 said it would.


When will Chrome topple IE?


Then there are two interesting questions we face:


  1. When will Chrome overtake IE to be the number 1 used web browser worldwide? Our prediction made in July 2011 was that it would happen in June 2012.

  2. When will Chrome rise above 50% usage worldwide?


To answer these questions we look a year into the future, to January 2013, and predict how each of the browsers will fare. We based this prediction on the average monthly change in market share each browser had during January 2011 to January 2012, which was:


  • +5.08% – Chrome

  • +2.27% – Safari

  • -0.13% – Opera

  • -1.69% – IE

  • -1.75% – Firefox


As you can see, this means IE, Firefox, and Opera will keep slipping, and Chrome and Safari will keep increasing. As with any similar prediction, there is a big element of uncertainty here, especially given how fast moving the web browser market is. Also, we don’t take into consideration whether the usage for each month equals 100%, because the change is calculated for each browser separately.


When we add our prediction to the actual numbers up until this point, we get this chart:


If our prediction comes true, Chrome will by May 2012 be neck and neck with IE, and by June, it will have taken the lead. Note that this would be right on track with our prediction from last year.


Even more interesting, by the end of the year, Chrome will be approaching the 50% mark and by early next year, it will have passed it. It’s very likely that, at some point, the increase for Chrome will level off, but we think this will not affect it reaching over 50% market share. At worst (for Google), a leveling off in the popularity will only delay what is all but inevitable at this point.


The web browser war continues


Any which way you turn this, it’s clear that Google Chrome is on a roll and that it’s set to overtake IE after just having conquered Firefox. When it will happen is just a matter of time, and we look forward to seeing how the web browser war will develop. Obviously the progression for the browsers we have predicted cannot continue forever, as it’s consistent each month. There will be events happening and new products introduced – both hardware and software – that will affect the usage.


But nonetheless, we’re of course chuffed that our prediction from last year about when Chrome would pass Firefox turned out to be correct. Now we’ll just have to wait and see how our predictions about Chrome’s total dominance, reaching 50%, will turn out.


This was a post from the guys at Pingdom, a site monitoring service that makes sure you're the first to know when your site is down. Check it out for free.


Windows Phone 7 Marketplace Overtakes BlackBerry App World in Terms of Available Applications

Windows Phone 7 Marketplace Overtakes BlackBerry App World in Terms of Available Applications:

Last weekend, Windows Phone 7 Marketplace surpassed the 60K active applications milestone worldwide. Main contributor to this fact is the strong growth of new applications in January, where around 3000 new applications were added per week.


Another notable fact is that Windows Phone 7 Marketplace overtook BlackBerry App World in terms of available applications globally. This happened because in December and January, the number of applications in Windows Phone 7 Marketplace grew with 1750 more than BlackBerry App World did per week.


However, it does not seems that the winner of the two-horse race between BlackBerry App World and Windows Phone 7 Marketplace is announced yet. Both stores have different strategies in this battle. On the one hand, Microsoft quickly expands Windows Phone 7 Marketplace to more countries in order to gain market-power. On the other hand, RIM tries to attract Android developers by offering PlayBooks for those who submit Android applications for PlayBook OS 2.0 before February 13. The effects of this action is already noticed in the data, because BlackBerry added more new application to App World than Windows Phone 7 Marketplace did last week.

iOS passes Mac OS in Share of Web Traffic Propelled by Sales for Mobile and Tablet Devices

iOS passes Mac OS in Share of Web Traffic Propelled by Sales for Mobile and Tablet Devices:

Apple sold a historic number of mobile devices in 2011. IDC reports that in 2011, Apple shipped 93.2 iPhone units and sold an impressive 40 million+ iPad units. In Q4 alone, Apple sold 17.07 million iPhones, 11.12 million iPads, 6.62 million iPods but only 4.89 million Macs.


More so now than ever, mobile devices are playing a key role in the lives of consumers – and the new found industry shows no signs of slowing down. The mobile device industry is growing so fast, that it will likely become the predominant method for consumers to access and interact with the web in the near future. This poses the questions: When will we see mobile traffic overtake traditional desktop traffic, and what does this mean for the computing industry?


Given the record breaking mobile device sales reported by Apple in 2011 compared to their relatively low volume of PC units shipped, is Apple on the edge of cannibalizing its potential desktop market by focusing on its mobile device product mix? To investigate this trend, Chitika Insights compared overall web traffic market share of iOS and Mac OS.


To quantify this study, Chitika Insights analyzed several data sets composed of a series of US traffic taken from August 2011 to February 2012 out of the Chitika Ad Network (covering hundreds of millions of ad impressions). The user agents of individual impressions were then aggregated to determine relative overall share of the different operating systems. Our theory proved true as seen in the graph below:


The data shows that the web market shares of iOS and OS X have been converging steadily since August. iOS has been posting regular gains, and has experienced an overall growth of nearly 50%, whereas OS X has seen its market share decline by 25% since a high point in September. February marks the first point where a reversal in position can be seen in the respective operating systems. iOS passes Mac OS with 8.15% of all web traffic, whereas Mac OS only sees 7.96%.


Apple is renowned for its customer loyalty, so why is Mac OS experiencing a loss in web market share? Perhaps, Apples habit of launching cutting edge gadgets year after year is driving consumers to newer products. Combining this aspect with the similar functionality of iOS devices and a lower price point, it may be that consumers are choosing to go mobile, instead of purchasing more expensive Apple computers. Alternatively, the shift towards an on-the-go lifestyle could be driving mobile device purchases by the consumer, and thereby driving the corresponding increasing in mobile web usage.


Stay tuned to Chitika Insights for future studies focusing on Apple and web usage.

The world’s biggest startup

The world’s biggest startup:

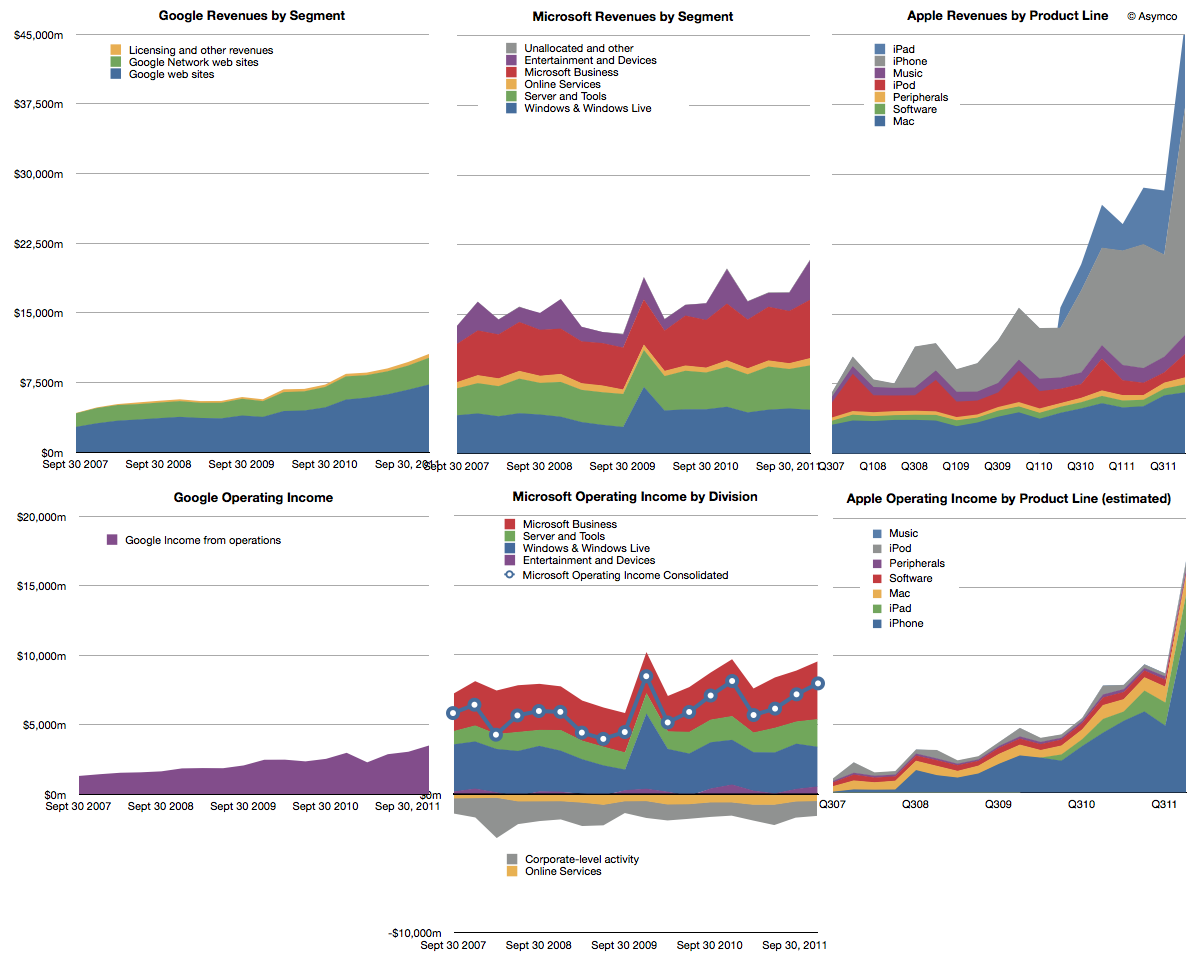
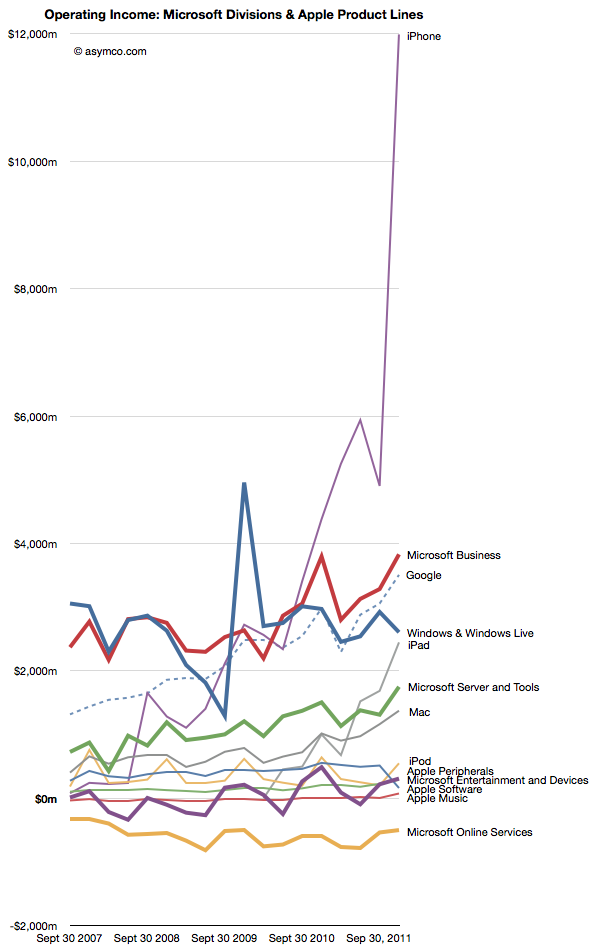
Last year we began offering revenue and operating income comparisons between Apple and Microsoft. It was becoming evident that the iOS franchise was beginning to overtake both in revenue and profitability the Windows franchise. To offer more dimensions of comparison this time I am adding Google’s top and bottom lines for comparison (click image for detail):


Note that the graphs have the same scales when read horizontally. I’ve broken out the sub-divisions of revenues as the companies report them. Here are some observations:


  1. The time spanned is 4.5 years (September 2007 to December 2011)

  2. If we compare the fourth quarter 2007 to fourth quarter 2011 the ratio of Google : Microsoft : Apple went from 1: 3.39:2:16 to 1:1.97: 4.38. In other words, Microsoft was 3.4 times bigger than Google but today it’s only about twice. Apple was twice and is now about 4.4 times bigger.

  3. In terms of operating income (i.e. before R&D, SG&A and OI&E) the ratios were 1:4.48:1.53 and are now 1:2.28:4.82. Microsoft’s income gap to Google halved while Apple’s more than tripled.

  4. Google and Microsoft have grown but not by adding new sources of revenue. Apple grew its base but, more importantly, added new businesses for spectacularly more growth.

  5. Compared to Microsoft and Apple, Google’s revenue is distinctly single-source: advertising. Though divided between own sites and those of affiliates, advertising is today 96.1% of revenue and was 98.6% four years earlier.


If we compare the individual product/business operating incomes individually we see some interesting patterns:


  1. Google’s advertising profits have overtaken Windows as has the iPhone and the iPad may do so quite soon.

  2. Microsoft’s Business (Office) and Server businesses are growing more quickly than Windows

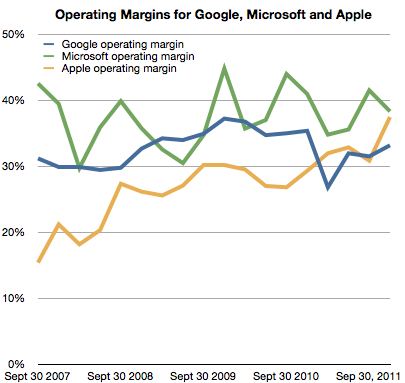
  3. The hardware oriented Apple’ operating margin is now 37% and exceeds Google’s 33% while being nearly equal to Microsoft’s 38% (see chart below)


I presented a subset of this material January 30th at a TechMeetups event titled “Apple – world’s biggest startup.” A presentation by Adam Lashinsky focused on the cultural and procedural aspects which highlight Apple’s “startup” nature. My presentation showed, using these graphs, Apple’s growth characterizes it as a “startup”. The growth did not come from a broadening of its core products markets. It came from the creation of new product categories. Google, a much younger company does not exhibit this non-secular growth any more than Microsoft which is about as old as Apple is.


The lesson is perhaps that rapid growth is not the right of small companies alone. Apple has used disruptive innovation to transform itself and offers a stunning contrast to two other companies which are also seen as innovative leaders.


Android OS Fragmentation Continues: Ice Cream Sandwich Present on Only 1.12% of Devices

Android OS Fragmentation Continues: Ice Cream Sandwich Present on Only 1.12% of Devices:

Android’s open nature is one of its key draws, for developers and users alike. The flexibility of its open standards provides incentive for developers to utilize the platform, given its reach to such a wide range of devices. In comparison, Android’s largest competitor, Apple’s iOS is a tightly controlled system, all its development held firmly under Apple’s management. There are positives and negatives to each approach, with flexibility and customization traded for a uniform experience and the ability for Apple to keep a consistently high quality check on every application that comes down the line.


With Android’s open nature, though, come some drawbacks. An open-source platform makes it hard to enforce the upgrades that come out, when they debut, and as each successive version of Android emerges, the OS has well-publicized issues with fragmentation. By the end of last year, though, Android has been making strides in combating the fragmentation issue, but is it enough?


Chitika Insights investigated the current state of Android’s fragmentation across mobile devices, checking in to see how much progress they had made in achieving market permeation with the latest versions of Android. Taking a sample of tens of millions of impressions from our network over the course of a week, we measured each Android version’s share of the traffic to estimate how the adoption rate for each version, as seen in the chart below:


The majorities of Android users are indeed on the same platform – Android 2.3.x, commonly called Gingerbread, and dominates the share with 66.29%. That still leaves a large amount of room for other versions to clutter the market, though, and Gingerbread is not Android’s most up-to-date release. Android’s latest version, Ice Cream Sandwich (release 4.0.x), arrived for public consumption in November of 2011. Thus, the large majority of Android users are one or more updates behind Android’s latest OS version. The latest version has seen a slow rate of adoption. As yet, our analysis shows only 1.12% adoption rates of this most recent version, up only slightly since our last study on January 20, 2012 where Ice Cream Sandwich was only seen on .4% of devices. As time goes on and more major manufacturers start pushing Ice Cream Sandwich with their newly released phones, this gap may close – but will it only close until the newest Android version comes out?


Despite the comparisons between Android and iOS, on the fragmentation issues it is a difficult comparison to make. Unlike the iPhone or iPad, which are single products being controlled by a single manufacturer, the Android OS is not controlled by a single distributor. It is released on myriad devices over myriad manufacturers and will be spread over dozens of different products each year rather than only one phone and only one tablet. This inherent diversity of products may make Android’s strength perpetually its weakness. It has taken steps to overcome it, but if these steps will ever be enough to get past the variegation built into such an open system is something we will have to see in time. You can be sure Chitika Insights will be there, keeping track and keeping you up to date on the latest Android developments.

Thursday, December 22, 2011

On being reasonable

On being reasonable:

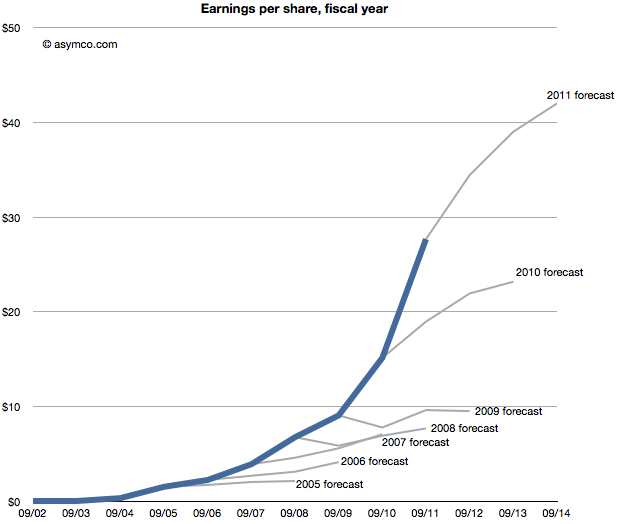
The discussion on why Apple is cheap was very useful. The debate brought into focus the possible causes for pessimism in the face of overwhelming evidence to the contrary. But maybe there is yet another explanation. The way the data was presented was as a difference between historic and projected growth rates. Is this the way analysts actually think?


Perhaps they don’t project growth based on historic growth, but project earnings given historic earnings. In other words they don’t look at the first derivative (change in earnings) but the shape of the actual data.


The following chart shows that data, i.e. forecasts as an extension of a sales trajectory. The blue area are actuals and the grey branches show projections at a given end of fiscal year.


Seen this way, we can imagine how the projections can be considered “reasonable”. Some appear to be linear extrapolations while others show up as the end of “S-curves”.[2]


What none of them imply is exponential growth. But would forecasting exponential growth be considered reasonable? Clearly not since it’s never been consensus. But disruptive companies do follow non-linear growth. In fact, every company that has gone from being small to being big (which is to say all large companies) went through non-linear growth phases. The “natural” shape of growth is exponential.


The failure is therefore not of reason but of failing to use a model that assumes acceleration of sales. I believe that institutional financial advisors are conditioned (or coerced) into assuming that nothing unreasonable ever happens. That seems like a completely flawed foundation to stand on.


Notes:


  1. This post is inspired by the New York Times chart showing budget forecasts.

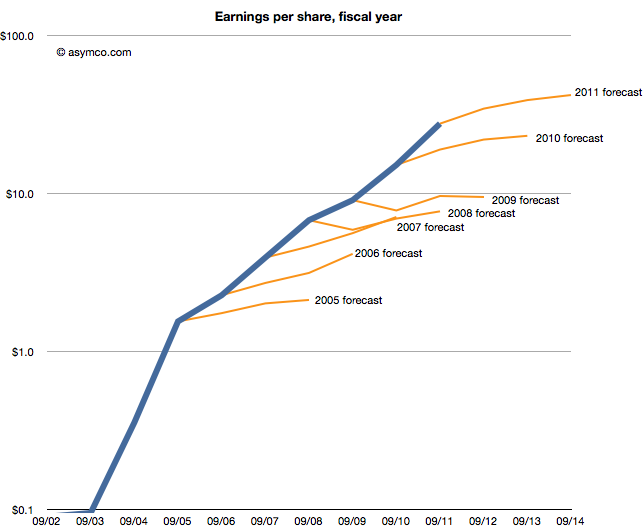
  2. The same data shown on a log scale:


Distimo Releases Full Year 2011 Publication

Distimo Releases Full Year 2011 Publication:

It is our pleasure to release our latest Distimo Publication.


This report will give an overview of the most important developments in the mobile app stores in 2011. How did the store sizes develop over the last year? Which store generates most revenue nowadays? What are the most downloaded apps of 2011? These questions will be answered in Distimo’s yearly publication. All data covers the stores during the period January – November 2011 in the United States, unless otherwise noted.


The key findings from this report are:


  • Both the Apple App Store for iPad and the Apple App Store for iPhone still beat the Google Android Market in terms of the total revenue generated by the 200 highest grossing apps. The Apple App store for iPhone generates about four times the revenue that is generated in the Google Android Market.Total revenue generated in the app stores

  • 2011 was the year where in-app purchases and the freemium business model became one of the most important monetization strategies for developers. Half of the revenue of the 200 top grossing apps in the Apple App Store for iPhone is now generated by freemium apps. This proportion is even higher in the Google Android Market where 65% of the revenue from the top grossing apps is generated by freemium apps.

  • The number of downloads in the Apple App Store for iPhone in China increased drastically during 2011. Comparing the number of Apple App Store downloads in the US with the number of Apple App Store downloads in China, we see that China now generates 30% of the total downloads of these two countries in the Apple App Store for iPhone. The number of downloads generated in the Apple App Store for iPad in China are even closer to those generated in the US: China generates 44% of the iPad downloads of these two countries.

  • A dip can be observed in the number of downloads generated in the respective Apple App Stores just prior to the release of a new Apple device, e.g. iPhone or iPad. The number of iPad downloads was at a yearly low in February just before the launch of the new iPad, but they immediately increased again in March. The same happened with the launch of the latest iPhone in October.

  • Nearly all of the app stores more than doubled their number of available apps in 2011. Windows Phone 7 Marketplace showed the largest relative growth of all stores with more than 400% year-on-year growth. Combined, the seven major app stores now offer more than one million apps.

  • The Windows Phone 7 Marketplace is now the fourth largest app store when looking at the total number of available games, having surpassed both the Nokia Ovi Store and BlackBerry App World. The Amazon Appstore – larger than both the Nokia Ovi Store and BlackBerry App World as well in terms of available games – is now the fifth largest app store for games.


You can now download this publication.


The press kit including all image files is also available.


Aside from this free publication, our annual paid report for 2011 is available for purchase for North America, Europe and Asia now as well.

How many Android phones have been activated? (Updated)

How many Android phones have been activated? (Updated):

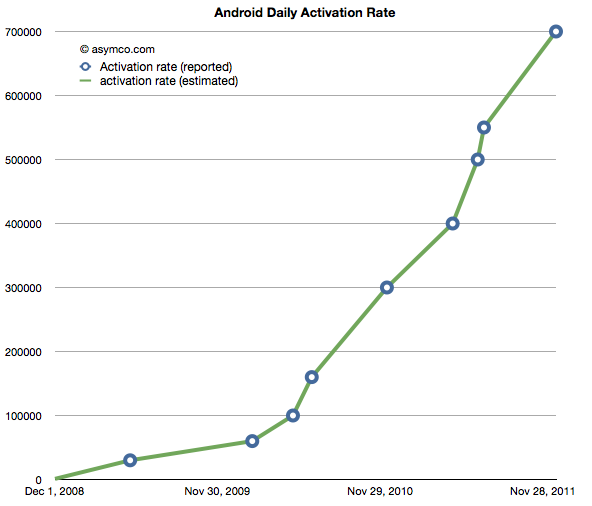
The following chart shows the reported (circled points) and estimated (lines) for Android activations. The resolution of the sampling is every seven days.


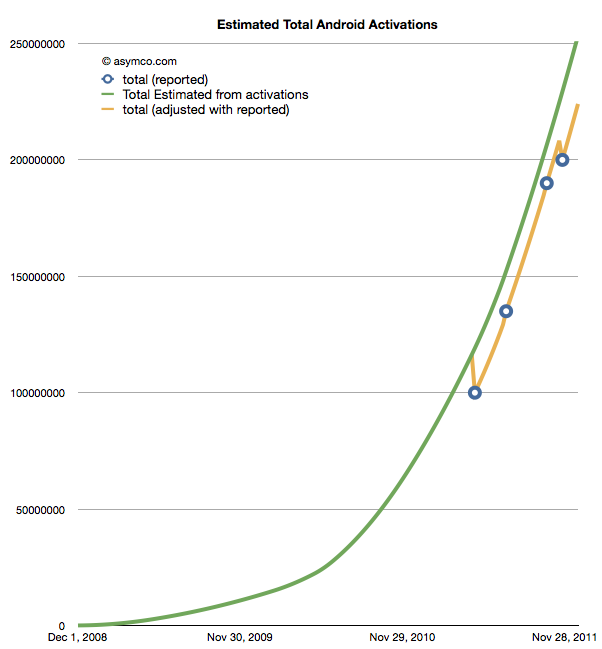
If we take these estimates and then compile a cumulative total of activations we get the green line in the chart below.


The wrinkle in the picture is that Google also occasionally reports cumulative estimates of total Android shipped. They are shown as the blue circles in the chart above. There is some room for error as the cumulative totals may not be reported the same day they happen and the assumptions in the activation rates may not be reflecting occasional slowing.


However that leads to a problem. By adjusting for the reported totals we get the orange line. The trouble with it is that it has these improbable “kinks” where the total is adjusted down, something that is not happening in reality. It’s a kludge we need to make estimates fit reality. Normally, this is something we can sweep under the carpet, but with the size of the market, the errors creep up to tens of millions of unitis.


The first downward adjustment would have been 19 million in May. Today, the difference between the green line and the orange is about 25 million.


So the best we can say right now is that there have been between 224 and 253 million Android devices activated to date. Why Google does not report this data regularly and consistently remains a mystery.


Update: The data used in the charts above is available as a Google Docs spreadsheet here.


Google & Apple Leave The Competition Trailing

Google & Apple Leave The Competition Trailing: The latest figures on the state of the U.S. smartphone market confirm what we already knew in that Google and Apple are dominating the scene, but they also underscore just how much work the competition has to do to even make an impact let alone catch up. The figures come from The NPD Group and are good for the year up until October.

The two front runners, Google and Apple, control a whopping 82% of the market between them. Google's Android platform is the leader with over half the market (53%), whilst Apple's iOS platform saw an increase in its share and now stands at 29%. That's great news for those two comanies, but others aren't so fortunate.

RIM, which seems to lurch from one disaster to another these days, now only controls 10% of the market. Just two years ago in 2009 RIM had a 44% market share. Even last year RIM was able to boast that it had 25% of the market under its belt. The phrase 'how the mighty have fallen' would seem very apt in RIM's case. A series of unexciting handsets, technical problems, corporate intransigence and market pessimism have seen RIM dwindle to a shadow of their former glory. At this rate it won't be long before their market share slips into single figures.

It's not just RIM who are facing hard times though, Microsoft too is up against a challenge in the American smartphone market. Windows Phone 7 only has a 2% share and even when combined with WindowsMobile (yes people are still using that) Microsoft barely manages to scrape together 5%. For all their marketing and the positive critical reception Windows Phone received at launch it simply hasn't made much of an impression with consumers. Of course Nokia has weighed into the battle and no doubt Microsoft is hoping that the world's biggest handset manufacturer can make a success of Windows Phone were others have failed.


Android Down, Kindle Outperforms iPad & RIM On The Up

Android Down, Kindle Outperforms iPad & RIM On The Up: Millenial Media released their latest figures today, covering last month, and they make for some very interesting reading. The normal patterns of Android going ever upwards, iOS maintaining an even keel, and RIM racing towards oblivion have been turned on their heads in this latest data set.