Wednesday, November 09, 2016


Saturday, October 08, 2016
Sunday, August 09, 2015

Thursday, March 05, 2015

Wednesday, August 06, 2014
Wednesday, June 04, 2014

Tuesday, June 03, 2014

Sunday, November 10, 2013
 D
D
 Samsung C
Thursday, June 06, 2013
Forecasting Windows market share
Forecasting Windows market share:
Last week Frank X. Shaw, VP of corporate communications at Microsoft stated:
Which is why I’ve always added the tablet data to the PC data to create a picture of the “personal computing” market. And this is what that picture looks like today:

Note how the share of various platforms has evolved over this brief time span:

Seen this way, Windows has now reached 60% market share and it’s likely to dip below 50% during this year. What happens beyond then is harder to imagine. If Windows tablets start growing as fast as the tablet market overall then Windows could stabilize in share. But if Android and iOS tablets follow their phone brethren in growth then it will be far harder for Microsoft to maintain share. But is that cause for concern?
Not necessarily.
The total computing market[1] is likely to expand to over 4 billion users with 1.5 devices per user in the next five years. That expansion implies that 20% share equals more than one billion devices, making such an ecosystem “good enough” for the average developer. It certainly has been good enough for Windows developers to date and they have kept hiring it throughout the new mobile app revolution.
So even if Windows dips to only 20% of the world’s computing market it will still be perfectly “viable” for some time to come.
–
Last week Frank X. Shaw, VP of corporate communications at Microsoft stated:
… most of the people around me were using their iPads exactly as they would a laptop – physical keyboard attached, typing away, connected to a network of some kind, creating a document or tweet or blog or article. In that context, it’s hard to distinguish between a tablet and a notebook or laptop. The form factors are different, but let’s be clear, each is a PC.Actually this “admission” that iPads are PCs is not something new. Steve Ballmer made the same assertion in 2010 pre-iPad (though calling them slates). Arguably, the notion that tablets are PCs has been dogma at Microsoft for over a decade and Windows running on all form factors has been a strategic guiding principle.
Which is why I’ve always added the tablet data to the PC data to create a picture of the “personal computing” market. And this is what that picture looks like today:
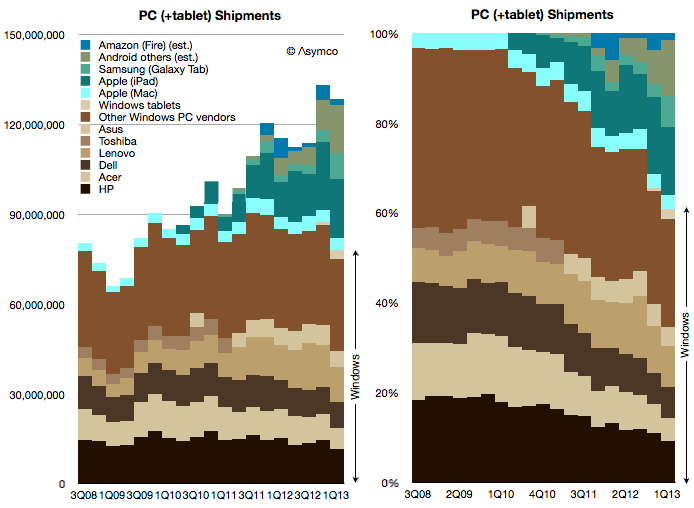
Note how the share of various platforms has evolved over this brief time span:
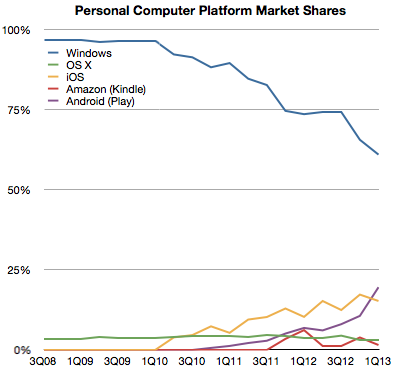
Seen this way, Windows has now reached 60% market share and it’s likely to dip below 50% during this year. What happens beyond then is harder to imagine. If Windows tablets start growing as fast as the tablet market overall then Windows could stabilize in share. But if Android and iOS tablets follow their phone brethren in growth then it will be far harder for Microsoft to maintain share. But is that cause for concern?
Not necessarily.
The total computing market[1] is likely to expand to over 4 billion users with 1.5 devices per user in the next five years. That expansion implies that 20% share equals more than one billion devices, making such an ecosystem “good enough” for the average developer. It certainly has been good enough for Windows developers to date and they have kept hiring it throughout the new mobile app revolution.
So even if Windows dips to only 20% of the world’s computing market it will still be perfectly “viable” for some time to come.
–
- I define the computing market as the total number of devices which have (a) a CPU (b) a broadband connection (c) a native application execution environment which is open to third party apps. This definition implies the presence of an “ecosystem” which is bound specifically to a platform.
Measuring US Mobile Platform Shares: Kantar vs. comScore
Measuring US Mobile Platform Shares: Kantar vs. comScore:
The latest comScore US smartphone install base data is in and there are few surprises. iPhone has reached a new record high penetration (39.2%) and user base (54.3 million). Android has reached a new high in user base (72 million) but share at 52% is below the peak reached in November 2012.

This pattern of gradual iPhone share gain in the US has been consistent for over two years even while Android has catapulted into an overall lead. The surprising thing is how Android seems to have peaked in share. There are still 95 million non-smartphone users and there seems to be headroom for growth even though the other platforms have been tapped out. But it does not seem that Android phones have any particular advantage over iPhone. My hypothesis remains that as price is taken out as a differentiation, the adoption of iOS is slightly higher than Android.
Another measure of market performance is the implied net platform user gains which is shown below:

It shows that iOS added more users in the last few months than Android.
The problem is that Kantar Worldpanel measures shipments and their share data shows a seemingly different picture.

In their data Android is shown as selling more units during January through April while Apple sold more during October through December. Of course we don’t have the absolute number of units so can’t see the effect of higher holiday overall sales volume. Nevertheless, the balance of growth seems to be disproportionately in favor of Android relative to the data from comScore.
To look at the situation more closely I measured the differential in user adds for comScore and the differential in market share for Kantar’s data. Then I overlaid the two differentials so that months are matching, as shown below:

There is a similarity to the frequency of oscillation with comScore data showing a delay (as would be expected since their data is sampling over a three month period). However, we are still facing a vertical offset where there is apparently more growth bias for iPhone in the comScore data.
Possible factors which might be explanatory:
The latest comScore US smartphone install base data is in and there are few surprises. iPhone has reached a new record high penetration (39.2%) and user base (54.3 million). Android has reached a new high in user base (72 million) but share at 52% is below the peak reached in November 2012.
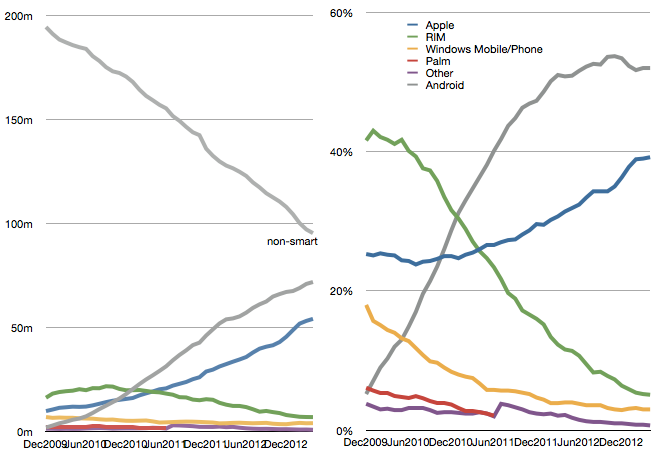
This pattern of gradual iPhone share gain in the US has been consistent for over two years even while Android has catapulted into an overall lead. The surprising thing is how Android seems to have peaked in share. There are still 95 million non-smartphone users and there seems to be headroom for growth even though the other platforms have been tapped out. But it does not seem that Android phones have any particular advantage over iPhone. My hypothesis remains that as price is taken out as a differentiation, the adoption of iOS is slightly higher than Android.
Another measure of market performance is the implied net platform user gains which is shown below:
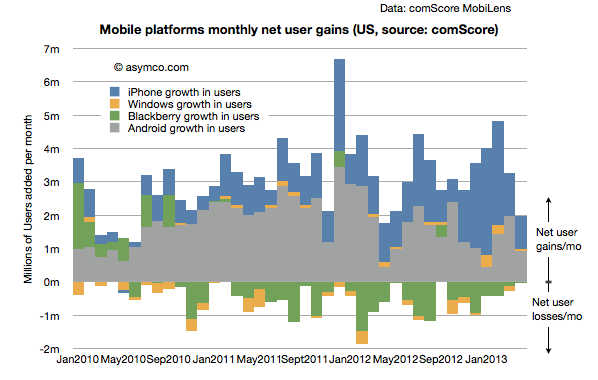
It shows that iOS added more users in the last few months than Android.
The problem is that Kantar Worldpanel measures shipments and their share data shows a seemingly different picture.
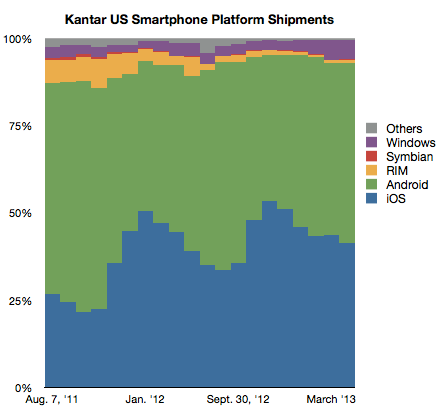
In their data Android is shown as selling more units during January through April while Apple sold more during October through December. Of course we don’t have the absolute number of units so can’t see the effect of higher holiday overall sales volume. Nevertheless, the balance of growth seems to be disproportionately in favor of Android relative to the data from comScore.
To look at the situation more closely I measured the differential in user adds for comScore and the differential in market share for Kantar’s data. Then I overlaid the two differentials so that months are matching, as shown below:
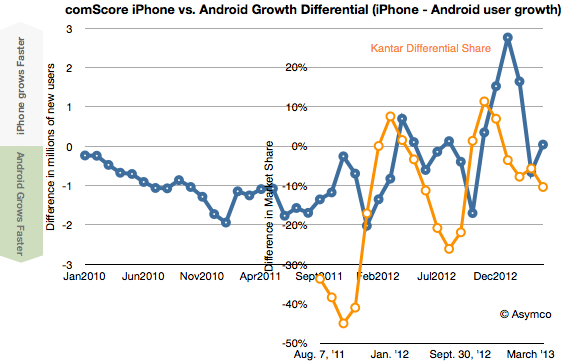
There is a similarity to the frequency of oscillation with comScore data showing a delay (as would be expected since their data is sampling over a three month period). However, we are still facing a vertical offset where there is apparently more growth bias for iPhone in the comScore data.
Possible factors which might be explanatory:
- Methodologies used. comScore data excludes ages below 13 and non-personal devices (business expensed phones.)
- Replacement sales are invisible in comScore data since the user base does not change when phones are replaced (and old ones are discarded.)
- Missing data from Kantar. Given their survey methods it’s possible that their panels miss some market segments.
Tuesday, June 04, 2013

Wednesday, May 29, 2013

Friday, May 24, 2013


Monday, May 06, 2013

Measuring Platform Churn
Measuring Platform Churn:
The latest comScore data shows consistent growth in US smartphone penetration. The rate is now 58.4% of adult consumers who own phones. This is up from 20% only three years ago. The rate of growth remains a remarkable 1.2% per month. That’s 700,000 new-to-smartphone users every week. The historic average over 3 years has been 1.07%/month This after having crossed over 50% on schedule in August 2012. There appears to be no slowing.

The next milestone I have pencilled in is the 80% mark which I extrapolate to be achieved by October 2014. 80% could be considered “saturation” which would signify a rapid slowing of new user addition. However, that might still not happen until 100%, depending on the availability (or lack thereof) of non-smartphones to buy.
This time frame is important because it would imply that essentially all mobile users in the US (some 234 million) would be a part of one ecosystem in about 2 more years. That’s less than the life cycle of the typical mobile contract (and thus the life of one phone). Put another way, by the time a new buyer today is ready to buy the replacement to their phone the market will be saturated.
This implies the mode of competition will be changing to smartphone replacement rather than smartphone adoption. To some degree this is already happening but as the net user gains data shows only BlackBerry and Windows platforms have had any net user declines in the last two years. “Platform churn” is still a relatively rare phenomenon.
How that will change post-saturation will be a crucial determinant to platform growth. The data today points to a higher degree of loyalty for iOS users and potential erosion in the Android user base as a result. There are ways of forecasting this on the basis of survey data as Carl Howe did. However, the data from comScore has already begun to show that Android may have peaked around 54% share. Android share is now at the same level it was in July while iPhone share has grown by more than 6 points since then.

There is a pattern of higher growth into the end of the year and an iPhone plateau into the first quarter, undoubtedly due to holiday buying favoring the iPhone. I don’t want to discount the possibility of some change in this pattern but so far there seems to be a plausible reason for it: with iPhone pricing and availability in the US offering no advantages to alternatives, Apple’s product is the most popular. Nearly more popular even than all the other competitors combined.
The latest comScore data shows consistent growth in US smartphone penetration. The rate is now 58.4% of adult consumers who own phones. This is up from 20% only three years ago. The rate of growth remains a remarkable 1.2% per month. That’s 700,000 new-to-smartphone users every week. The historic average over 3 years has been 1.07%/month This after having crossed over 50% on schedule in August 2012. There appears to be no slowing.
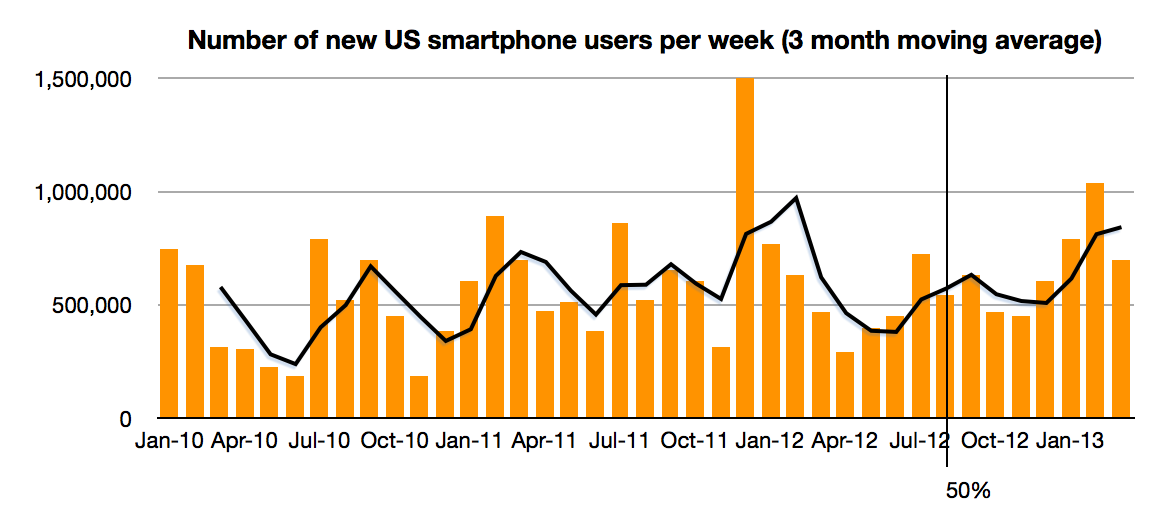
The next milestone I have pencilled in is the 80% mark which I extrapolate to be achieved by October 2014. 80% could be considered “saturation” which would signify a rapid slowing of new user addition. However, that might still not happen until 100%, depending on the availability (or lack thereof) of non-smartphones to buy.
This time frame is important because it would imply that essentially all mobile users in the US (some 234 million) would be a part of one ecosystem in about 2 more years. That’s less than the life cycle of the typical mobile contract (and thus the life of one phone). Put another way, by the time a new buyer today is ready to buy the replacement to their phone the market will be saturated.
This implies the mode of competition will be changing to smartphone replacement rather than smartphone adoption. To some degree this is already happening but as the net user gains data shows only BlackBerry and Windows platforms have had any net user declines in the last two years. “Platform churn” is still a relatively rare phenomenon.
How that will change post-saturation will be a crucial determinant to platform growth. The data today points to a higher degree of loyalty for iOS users and potential erosion in the Android user base as a result. There are ways of forecasting this on the basis of survey data as Carl Howe did. However, the data from comScore has already begun to show that Android may have peaked around 54% share. Android share is now at the same level it was in July while iPhone share has grown by more than 6 points since then.
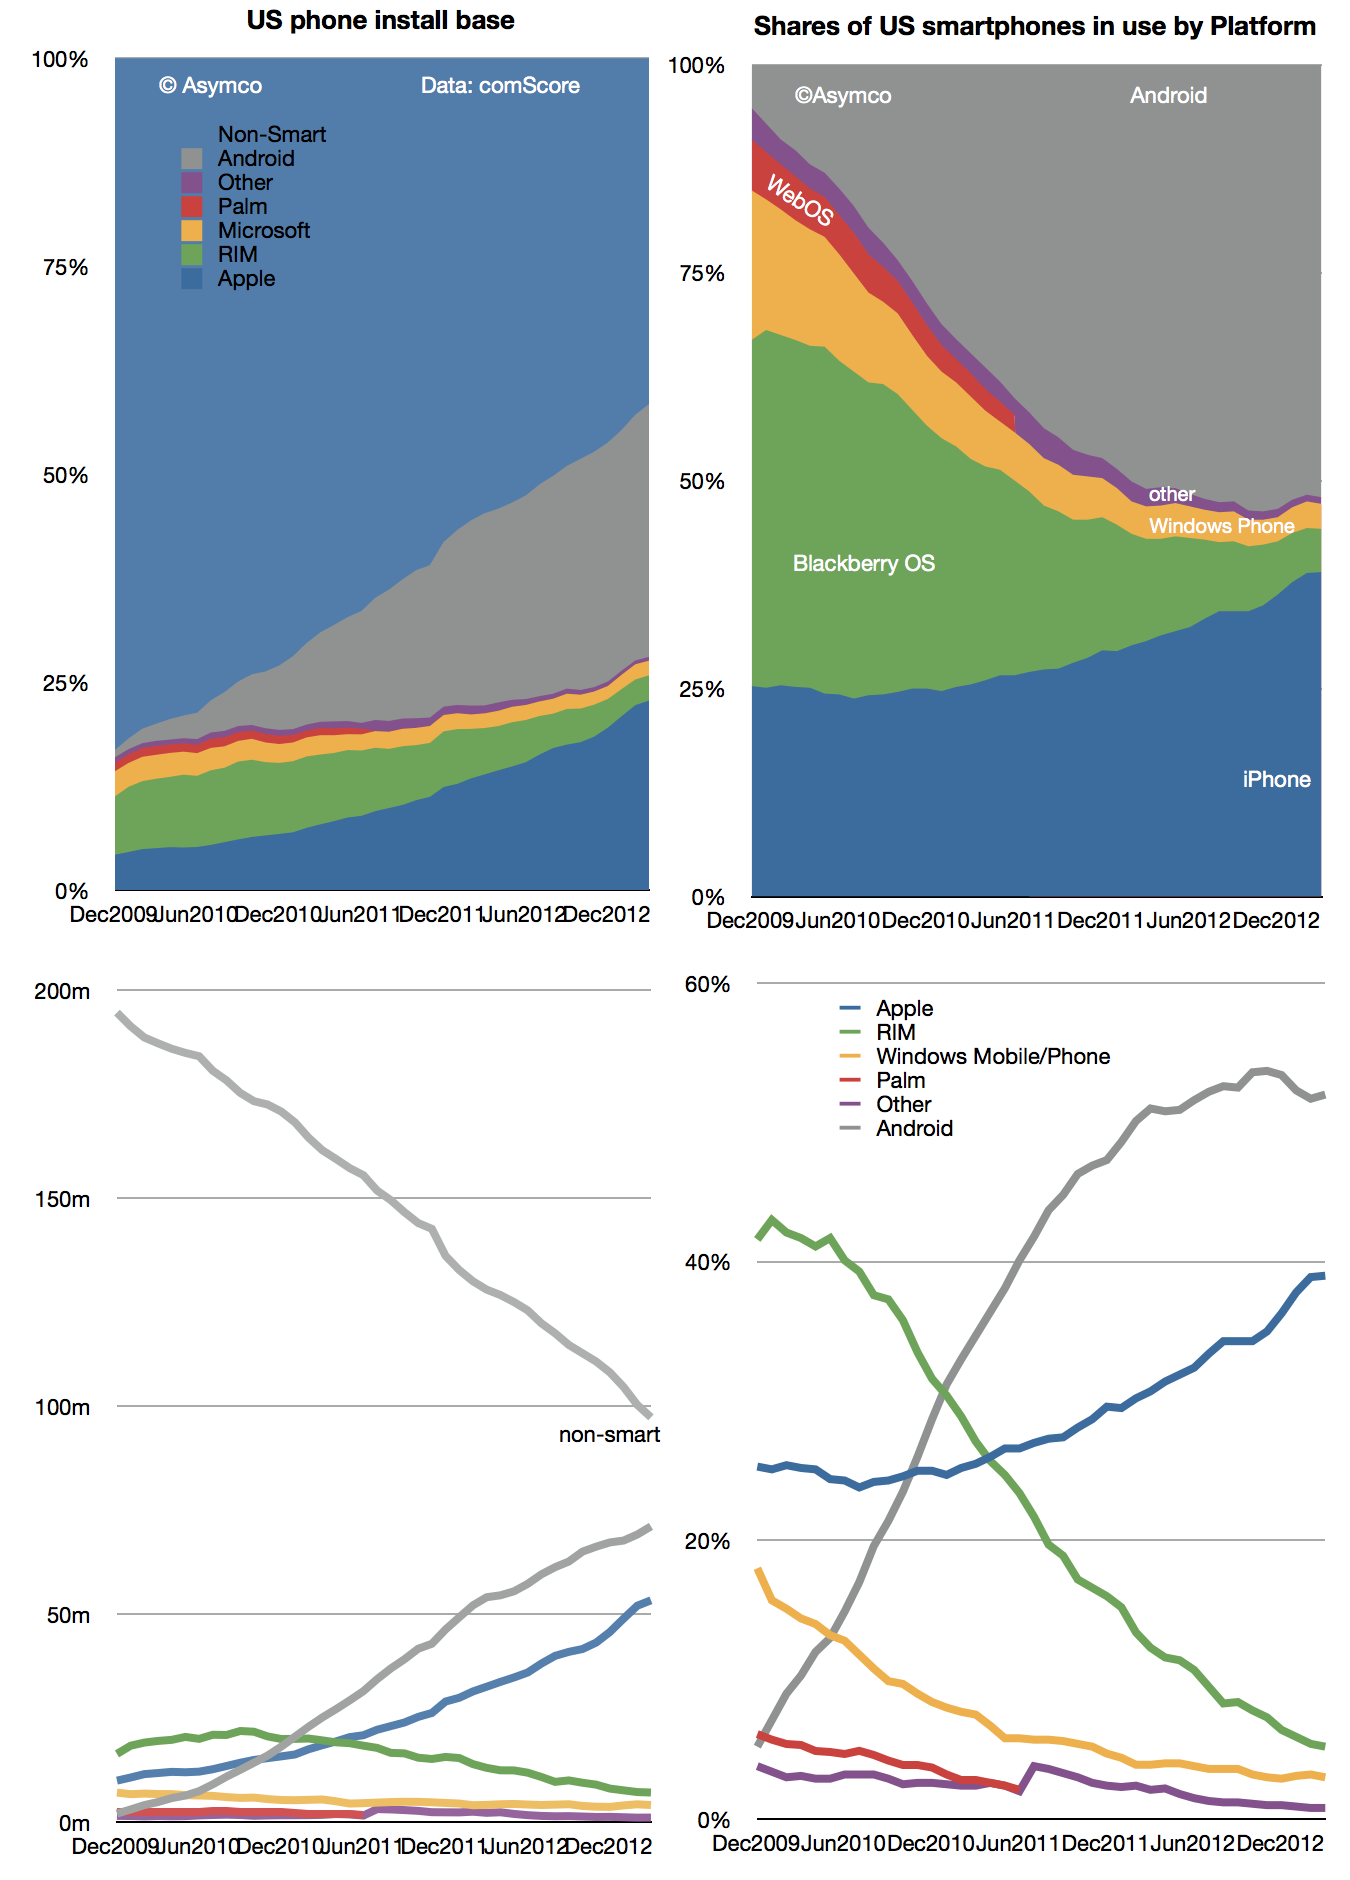
There is a pattern of higher growth into the end of the year and an iPhone plateau into the first quarter, undoubtedly due to holiday buying favoring the iPhone. I don’t want to discount the possibility of some change in this pattern but so far there seems to be a plausible reason for it: with iPhone pricing and availability in the US offering no advantages to alternatives, Apple’s product is the most popular. Nearly more popular even than all the other competitors combined.
Subscribe to:
Posts (Atom)