Pages

Live blogging Feed

Thursday, November 15, 2012

Google vs. Samsung

Google vs. Samsung:
Samsung’s recent success in mobile phones has been spectacular. It overtook Nokia for the top spot in overall unit sales. It went from having almost no smartphone sales to selling over 50 million units per quarter in a matter of two years.

It now accounts for nearly 40% of all industry profits.
A key decision which made this success possible was to shift its portfolio to smartphones and to offer a large variety of such phones.
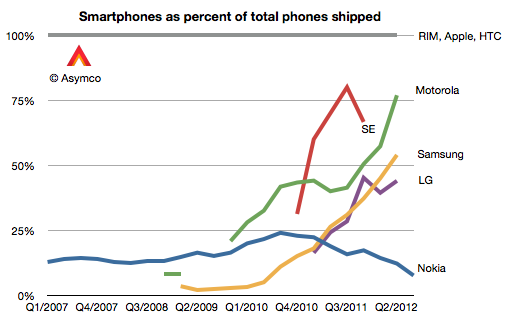
In Q1 2010 only 3% of the phones Samsung sold were smartphones. In the latest quarter the ratio was 54%. 
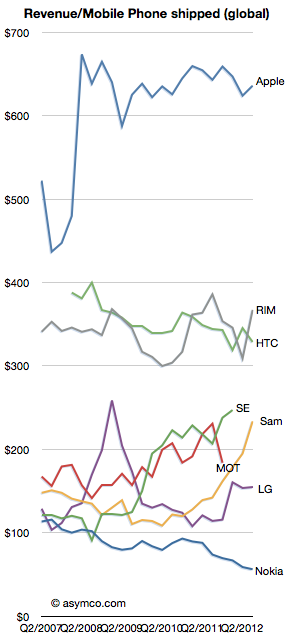
As a result the average selling price more than doubled, from $115 to $234.

Profit margins also soared in proportion: from 12% to 21%.

All this plus an overall growth in volumes from 64 million to over 100 million per quarter has meant that the company is raking in enormous profits. Not only did it overtake Nokia, the market share leader for 14 years, but is making more profits than Nokia ever did.
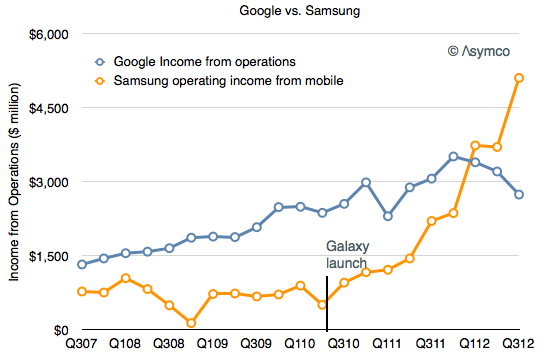
So much profit in fact that it has overtaken Google’s decisively.
The reason I point this out is that Samsung’s success is dependent on having ridden on the back of Android. Samsung’s ascent can be precisely timed to their adoption of Android. The groundbreaking Samsung Galaxy launch was the Galaxy S which shipped in June 2010.

Meanwhile, indications are that “mobile” is causing a contraction in Google’s margins.
If nothing else, Android has created a very interesting industry. There are many questions of course: Is Samsung’s trajectory sustainable? Why aren’t there other vendors successful with Android? Why isn’t Google successful with Android? Why isn’t Google’s Motorola successful with Android? What would happen if Samsung soaks up so much profit from mobile that it’s in a position to acquire Google and control the trajectory of their enabling platform?


The use of Siri

The use of Siri:
Findings of University College London research on the use of Siri amongst 661 iPhone 4S users from 79 countries.

Wednesday, November 14, 2012

Android malware surged in Q3? Sure, but only 0.5% came from Google Play

Android malware surged in Q3? Sure, but only 0.5% came from Google Play:
Last week, F-Secure released its 40-page “Q3 2012 Mobile Threat Report” (PDF) and of course the talk of the town was Android malware. The report included this scary-looking chart:
AndroidSamplesQ32012 Android malware surged in Q3? Sure, but only 0.5% came from Google Play
Unsurprisingly, the data was picked up all over the place. We decided to skip the story since it wasn’t clear how much of these threats were in the official Google Play Store; in fact “Google Play” was only mentioned once in the whole PDF.
In response to queries about a breakdown, however, F-Secure today revealed more numbers. Here’s what you have to know: out of the 51,447 samples discovered by the security firm last quarter, 28,398 were malicious samples, 146 of which came from Google Play, and 23,049 were potentially unwanted software (PUA), 13,639 of which came from Google Play.
This means that 55.20 percent of the samples were malware and the remaining 44.80 percent were risky. The difference is important: malicious apps intentionally cause harm to you or your phone, while risky apps do things like steal data, damage privacy, make payments, track web browsing, send your location, and so on.
More importantly, if only 146 of the 28,398 malware samples were found on Google Play, that means 0.51 percent were on the company’s store. This means most users, at least in countries where Google Play is available, won’t ever see these malicious apps.
That’s not all. F-Secure also underlined another important point today:
Note: please remember that sample does not necessarily equal threat. Based on our detections, the number of “families” in the wild is actually down when compared to Q3 2011
This chart puts things into perspective a bit better:
android malware families Android malware surged in Q3? Sure, but only 0.5% came from Google Play
In summary, if you’re an Android user, stick to the Google Play Store when looking for apps to download and install. Even then, always read the permissions an app is requesting from you and make sure they make sense for the app you’re trying to install.
In one year, Android malware up 580%, 23 of the top 500 apps on Google Play deemed ‘High Risk’ and FUD alert: 72% of all Android apps on Google Play access permissions they shouldn’t
Image credit: Iva Villi

Monday, November 05, 2012

comScore Reports September 2012 U.S. Mobile Subscriber Market Share

comScore Reports September 2012 U.S. Mobile Subscriber Market Share:

comScore Reports September 2012 U.S. Mobile Subscriber Market Share

Smartphone Penetration Surges Past 50% Threshold for the First Time
RESTON, VA, November 2, 2012– comScore, Inc. (NASDAQ: SCOR), a leader in measuring the digital world, today released data from the comScore MobiLens service, reporting key trends in the U.S. mobile phone industry during the three month average period ending September 2012. The study surveyed more than 30,000 U.S. mobile subscribers and found Samsung to be the top handset manufacturer overall with 26 percent market share. Smartphone penetration surged past the 50 percent threshold for the first time. Google Android led that segment of the market with 52.5 percent of smartphone subscribers, while Apple accounted for 34.3 percent.
OEM Market Share
For the three-month average period ending in September, 234 million Americans age 13 and older used mobile devices. Device manufacturer Samsung ranked as the top OEM with 26 percent of U.S. mobile subscribers (up 0.4 percentage points), followed by LG with 17.7 percent share. Apple continued to close in on the #2 OEM ranking with 17.5 percent of mobile subscribers (up 2.1 percentage points), followed by Motorola with 10.9 percent and HTC with 6.2 percent.

Top Mobile OEMs

3 Month Avg. Ending Sep. 2012 vs. 3 Month Ending Jun. 2012

Total U.S. Mobile Subscribers (Smartphone & Non-Smartphone) Ages 13+
Source: comScore MobiLens
Share (%) of Mobile Subscribers
Jun-12Sep-12Point Change
Total Mobile Subscribers100.0%100.0%N/A
Samsung25.6%26.0%0.4
LG18.8%17.7%-1.1
Apple15.4%17.5%2.1
Motorola11.7%10.9%-0.8
HTC6.4%6.2%-0.2
Smartphone Platform Market Share
119.3 million people in the U.S. owned smartphones (51.0 percent mobile market penetration) during the three months ending in September, up 8 percent since June. Google Android ranked as the top smartphone platform with 52.5 percent market share (up 0.9 percentage points), while Apple’s share increased 1.9 percentage points to 34.3 percent. RIM ranked third with 8.4 percent share, followed by Microsoft (3.6 percent) and Symbian (0.6 percent).

Top Smartphone Platforms

3 Month Avg. Ending Sep. 2012 vs. 3 Month Avg. Ending Jun. 2012

Total U.S. Smartphone Subscribers Ages 13+
Source: comScore MobiLens
Share (%) of Smartphone Subscribers
Jun-12Sep-12Point Change
Total Smartphone Subscribers100.0%100.0%N/A
Google51.6%52.5%0.9
Apple32.4%34.3%1.9
RIM10.7%8.4%-2.3
Microsoft3.8%3.6%-0.2
Symbian0.9%0.6%-0.3
Mobile Content Usage
In September, 75.5 percent of U.S. mobile subscribers used text messaging on their mobile device (up 0.5 percentage points). Downloaded applications were used by 54 percent of subscribers (up 2.6 percentage points), while browsers were used by 52.6 percent (up 2.4 percentage points). Accessing of social networking sites or blogs increased 2.1 percentage points to 39 percent of mobile subscribers. Game-playing was done by 34.4 percent of the mobile audience (up 1 percentage point), while 28.6 percent listened to music on their phones (up 1 percentage point).

Mobile Content Usage

3 Month Avg. Ending Sep. 2012 vs. 3 Month Avg. Ending Jun. 2012

Total U.S. Mobile Subscribers (Smartphone & Non-Smartphone) Ages 13+
Source: comScore MobiLens
Share (%) of Mobile Subscribers
Jun-12Sep-12Point Change
Total Mobile Subscribers100.0%100.0%N/A
Sent text message to another phone75.0%75.5%0.5
Used downloaded apps51.4%54.0%2.6
Used browser50.2%52.6%2.4
Accessed social networking site or blog36.9%39.0%2.1
Played Games33.4%34.4%1.0
Listened to music on mobile phone27.6%28.6%1.0
About MobiLens
MobiLens data is derived from an intelligent online survey of a nationally representative sample of mobile subscribers age 13 and older. Data on mobile phone usage refers to a respondent’s primary mobile phone and does not include data related to a respondent’s secondary device.
About comScore
comScore, Inc. (NASDAQ: SCOR) is a global leader in measuring the digital world and preferred source of digital business analytics. For more information, please visit www.comscore.com/companyinfo.

MediaTel UK Connected TV Trends: 2012 Q3

MediaTel UK Connected TV Trends: 2012 Q3:
This infographic demonstrates how the UK population is now watching catch-up TV across the different platform options, using data from the latest quarter of MediaTel's Connected TV Tracker survey, in association with YouGov. It shows that the majority of catch-up TV viewing in the UK is still via the computer, at 60%, but the year on year trend for this platform is declining, with all other platforms increasing their percentage share.

Galaxy Note II off to Hot Start on T-Mobile, Sprint

Galaxy Note II off to Hot Start on T-Mobile, Sprint:
Like the original model, the large screen of the Samsung Galaxy Note II exemplifies a new breed of hybrid devices – part smart phone, part tablet, nicknamed by many as the portmanteau, “phablet.” The Galaxy Note II’s 5.5 inch screen is only slightly smaller than a 7 inch tablet, making it capable of comfortably running some applications originally targeted for tablet users.
Each major carrier is releasing a version of the Galaxy Note II at varying points this fall.  T-Mobile began selling the smartphone on October 24th, 2012. The carrier was then followed by Sprint (October 25th) and U.S. Cellular (October 26th). Both AT&T and Verizon are releasing their versions of the smartphone in November, with Verizon including a custom home button and a reported launch date in late November – over a month after its competitors debuted the phone on their networks.
Chitika Insights looked to quantify how well the Samsung Galaxy Note II is being adopted with its large screen size and staggered releases.  To quantify this study, Chitika Insights looked at a sample of tens of millions of impressions from the Chitika ad network from October 23rd to October 28th, 2012.  Isolating Samsung smartphone Web impressions, we were able to see the rise in Samsung Galaxy Note II usage.
48 hours after the U.S. Cellular launch and 4 days after T-Mobile, the Samsung Galaxy Note II made up 0.33% of all Samsung’s smartphone Web traffic. This is a strong start for the new smartphone as two major carriers are still waiting to release the device. Additionally, as we’ve seen previously, the larger screen size could increase the Web browsing habits of Galaxy Note users.
As each carrier possesses its own unique variant of the smartphone, we were able to generate an exact breakdown of Galaxy Note II traffic by carrier using 24 hours of data from October 28th, 2012.
It’s not surprising that T-Mobile, with its extra day of sales, is in the lead with 53% of all U.S. Galaxy Note II Web traffic coming from users of its phone variant. Close behind is Sprint, with U.S. Cellular making a small, early impact. While we anticipate large shares eventually going to late arrivals AT&T and Verizon, the latter will be at a relative disadvantage when selling the Galaxy Note II, as most of its competitors will have had the phone out for over a month.

The Future of Email

The Future of Email:
The explosion of social and mobile is transforming today’s inbox. Learn the trends and strategies for integrating email + social + mobile to drive digital marketing success.

The Future of Email
Browse more infographics.


The state of Linux (infographic)

The state of Linux (infographic):
As LinuxCon Europe starts today in Barcelona, we present an infographic about the state of Linux. It has details about distributions, the Linux kernel, the Linux job market, drivers for adoption, and much more.
In addition to taking a look at the state of Linux, we want to give everyone attending LinuxCon Europe a really cool gift: a 1-year FREE Pingdom Business Account.
Read on to find out more about Linux as well as how to claim your FREE Pingdom account.

The state of Linux

We know you want your free account, but before we get to that, let’s have a look at the current state of Linux.
The state of Linux

Get your FREE Pingdom Business account

We want to give each and every one attending LinuxCon Europe a FREE 1-year Pingdom Business Account.
This is worth almost $500!
Here’s what you do to get your account:
  1. Take a photo of yourself and your badge at LinuxCon Europe. It’s important that we can read your name (at least) on the badge.
  2. Tweet this photo to @pingdom, and include the #linuxcon hashtag.
Once LinuxCon Europe is over, we’ll get in touch with you, get your email address, and issue the free account. Note that this offer is only available for new Pingdom accounts and cannot be used for upgrades or renewals.
We hope you enjoy LinuxCon!

This was a post from the guys at Pingdom, a site monitoring service that makes sure you're the first to know when your site is down. Check it out for free.

The late smartphone adopter paradox

The late smartphone adopter paradox:
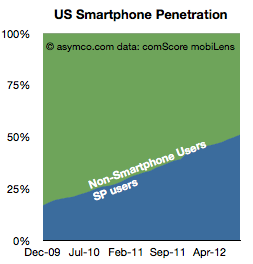
comScore reports that US smartphone penetration has decisively crossed over 50% in August. This should not come as a surprise as the penetration rate has been very linear.

Now that we’ve crossed this milestone, the thing to watch is the conversion rate from smartphone non-consumption to smartphone consumption.
The reason is that we don’t know what “saturation” means in smartphones. We can assume it’s at least 80% as about 80% of new phones being purchased are smartphones. What we don’t know is how much above 80% it can be. It could  be 100% if feature phones simply stop being made but we can’t be sure if there will be latent demand and how long this will last (similar to the market for black-and-white TVs after Color became commonplace).
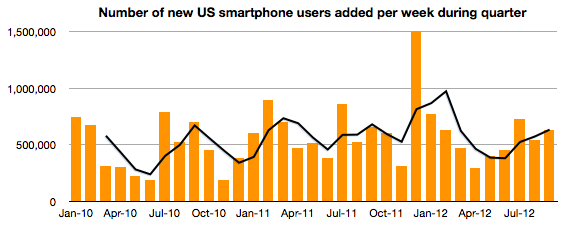
To help keep an eye on this measure, the following graph shows the rate at which non-smart to smart conversion is happening.

It measures the addition of new (to smart) subs each week in a particular measurement period (three months ending the month shown on the x-axis). There is also a 3 period moving average shown as a line. Keep in mind that this shows net new users and therefore excludes smartphone switchers. It’s a good measure of how rapidly non-consumers are being converted to consumers.
The data shows that there are as many first time smartphone adoptions in late 2012 as there were in late 2010. Or, the new-to-smart users are joining ecosystems just as quickly when penetration is 50% as when it was 20%. An encouraging situation when considering the opportunity space above 50%. The “S-curve” has not reached an inflection point.
If you’re thinking about growth, so far so good. There is however one surprise in the data.
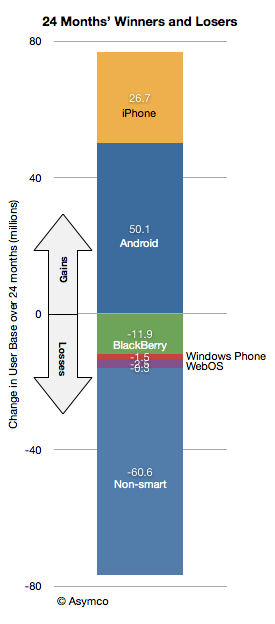
All the growth in the last 24 months (between 2010 and present) was due to Android and iOS. Android added 50 million and iOS added 26 million in the last 24 months. The net smartphone user additions were about 60 million (RIM lost about 12 million, Windows lost 1.5 million and others lost 2.6 million). Android therefore has gained twice as many users as iOS has in this two-year period. Put another way, Android captured 70% of the growth and iOS captured 30% of the growth.

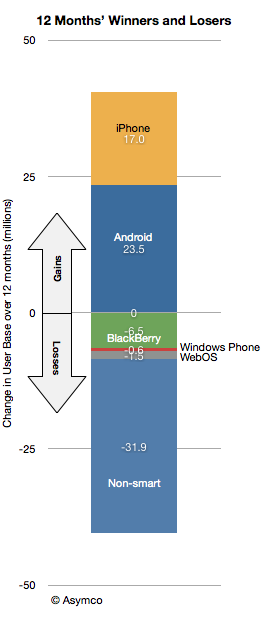
However, if we look at the last 12 months, the split is 23.5 million for Android and 17.0 million for iOS. Android gained 58% of the growth and Apple captured 42%–a change in “spread” from 40 points to 16 in favor of Android.

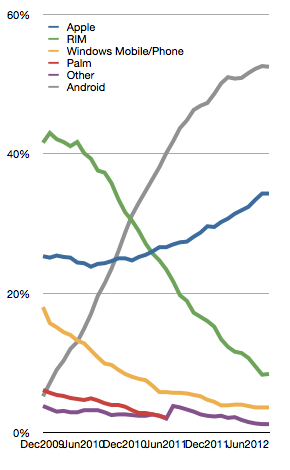
The evidence also shows itself in the trajectory of platform market shares of installed base.

In the last six months, Android share growth is slowing while iOS is still gaining.
If this trend continues then the next 50% may not behave as one might expect (namely that late adopters would take the low-cost commodity offering accelerating Android adoption.) Late adopters may, in fact, be choosier than early adopters. And it’s not at the cost of overall growth. Late adopters are still converting at the same rate of the early adopters.
Therefore, paradoxically, the late market shows that the prospect for iOS growth seems strong. Furthermore, as we do reach saturation, perhaps in another three years, the secular growth may end in the US but the loyalty of iOS usage may give iOS another advantage in a market where growth is determined by ”platform churn”
The US is the crucible of the phone market in many ways so what happens in the US may be a harbinger for what happens world-wide.


Friday, October 26, 2012

Foreshadowing iPhone sales

Foreshadowing iPhone sales:
AT&T, Verizon and Sprint have all reported the number of iPhone units shipped in Q3 2012. The history of the these sales is shown in the following graph:
Foreshadowing iPhone sales | LinkedIn
Read more:
Foreshadowing iPhone sales | LinkedIn.


End of the Reel: Analysis of the Online Movie Streaming, DVD & Video Game Rental Industry

End of the Reel: Analysis of the Online Movie Streaming, DVD & Video Game Rental Industry:
The idea of renting a movie is different than it was 20 years ago. Now, anyone can freely choose from a wide variety of services to watch movies and TV shows. You can even watch them on your phone, computer, any modern gaming console, and many mobile tablets.

Thursday, October 25, 2012

Nokia’s Lumia brand strategy for the US

Nokia’s Lumia brand strategy for the US:
Last July I asked the question “How many Lumia phones were shipped in the US?”
My answer was 630k through the first half of this year.
I revisit this question following Nokia’s latest quarterly report.
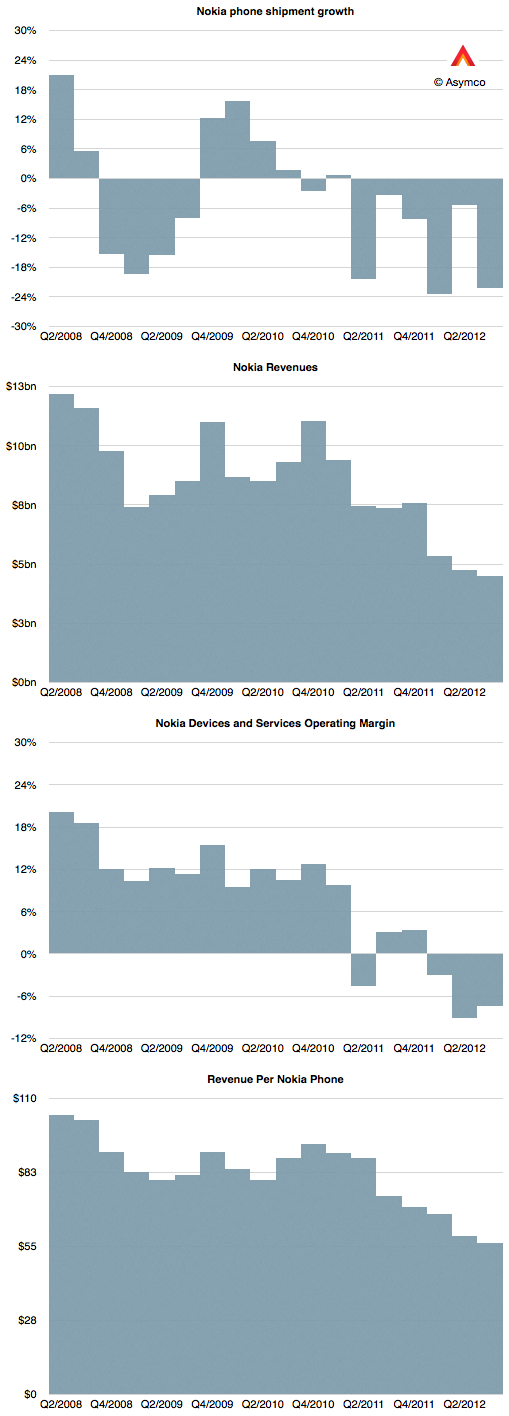
As a quick review, Nokia reported the following performance for its mobile phones operations:

The most worrying thing of all however is that Nokia’s smartphone performance has collapsed. With only 6.3 million units shipped, the company may be the worst performer among eight competitors I track. They were below RIM’s shipment total.
The value of 6.3 represents only 7.6% of their overall phone shipments.

As the graph above shows, Nokia is going in the wrong direction with respect to moving to a smartphone portfolio.[1]
Of the total 6.3 million smartphones (aka smart devices, as per Nokia’s reporting nomenclature) 2.9 million were Lumia Windows Phone units.
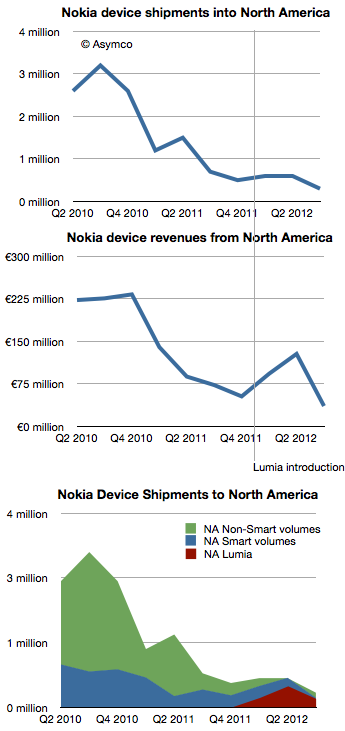
Using information about average selling prices and total volumes into North America, I was able to estimate that there were about 180,000 units sold into North America during the last quarter.

Since launch, my estimate is that Lumia has sold 810k units in the North American market.
This cannot be seen as a good performance. There are mitigating factors such as the lack of upgradeability to Windows Phone 8 which probably deflated demand[2]. However, it’s a poignant observation that during the last quarter the US reached 50% smartphone penetration by users. As traction is still absent from both Nokia and Microsoft in the US market, we are back to the question of how to compete.
As the market in the US transitions from competition against non-consumption to competition among rival platforms, the Lumia brand is being forced into targeting smartphone “switchers” rather than smartphone “adopters”. The switching option is expensive, requiring aggressive advertising (see Samsung Electronics’ $11 billion ad budget).
There’s only one source of cash for that sort of strategy.
—
Notes:
  1. The caveat is that they market some of the Series 40 phones are “smartphones” on the basis of having “smartphone-equivalent” performance. However, smartphone equivalency is and has been purely subjective. On that basis there were many times in the last decade and a half that we could have counted Java-based or BREW-based or i-Mode-based phones “smartphone-like”. Smartphone has been defined on the basis of running an operating system with native APIs for developers.
  2. I imagine that the upgrade path could have been known to Nokia, AT&T and Microsoft nine months ago when the Lumia was unveiled for the US by the three CEOs and therefore expectations could have been modulated accordingly.


[Infographic] The Mobile Industry in Numbers

[Infographic] The Mobile Industry in Numbers:
Presenting our latest infographic – The Mobile Industry in Numbers – the H1 2012 edition of the 100 Million Club, the watchlist of the top mobile platforms and handset manufacturers. This infographic will give you some insights into the mobile market and help put things into perspective.
Here are some of the insights from the infographic:

- Smartphone sales penetration continues to accelerate, growing from nearly 30% in Q3 2011 to nearly 40% in Q2 2012

- Nearly 2 out of every 3 smartphones shipped in H1 2012 were Android devices

- Despite low device sales, the Windows platform already has over 100K available apps in Windows Marketplace

- Although Symbian is obsolete, it still has a sizable installed base – larger than bada and Windows Phone combined

- In the handset market, Apple and Samsung account for 63% of revenues and over 98% of the profits, depriving other vendors of oxygen and therefore the ability to invest in handset differentiation and marketing

- In the smartphone market, Apple and Samsung claim more than half of total shipments. Nokia is shipping more Symbian handsets than WP handsets and their smartphone share has fallen to 7%, down from 16% in H2 2011

Nokia’s price for exclusivity

Nokia’s price for exclusivity:
Days after Nokia announced the end of life for the Symbian platform I wrote a post titled Who will buy the next 150 million Symbian smartphones? The reference was to claim by management that before there would be a complete transition to Windows Phone, 150 million legacy Symbian phones would be sold, keeping the company financially stable before the new ecosystem took root.
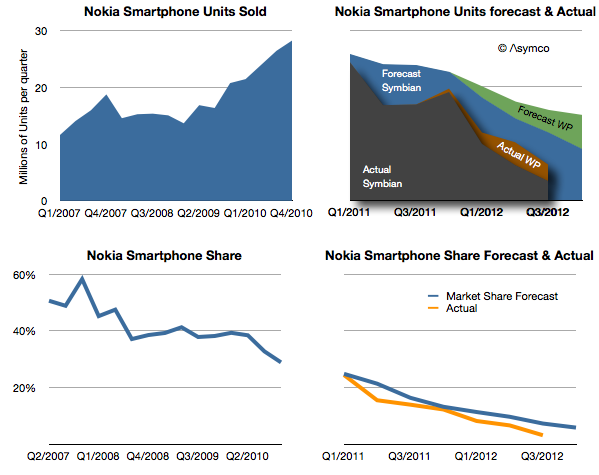
I reproduce the original forecast I made below with the addition of what actually happened.

[Note that the Actual stack area chart is independent of the forecast area chart as indicated by shading.]
My forecast in early 2011 was based on the 150 million Symbian phones being sold over a two year transition period. The implication with the forecast for Windows Phone was that this would still lead to a difficult contraction of volumes.
As it turns out, only 96 million Symbian devices have been sold in the 7 quarters since the platform was deprecated. It’s unlikely that there will be ever by 150 million units sold as last quarter only 3.4 million shipped. In any case, management has already retracted that claim.
What about the Windows Phone forecast? It turns out that by this point in time (Q3 2012) I had expected Lumia shipments to total 9 million. Actual shipments reached about 9.5 million, so not bad. However, the market grew faster than I had expected and overall Nokia smartphone market share turned out to be slightly lower (6.3% in Q2 vs. 10% estimated.)
The just ended quarter shares are not yet available but it’s quite possible that overall Nokia smartphones could be well below 5%, and may slip to 3% during the transition period.
My warning in February 2012 was that 150 million Symbian units would not ship since I expected there would be a stigma associated with the products among distributors, even if consumers were fine with them (which they weren’t).
The public execution of Symbian (and any other alternative being developed inside Nokia) will probably be a classic case study in disruption management. To wit: even if a platform needs to be led out to pasture, there are ways of managing decline other than suicide. Nokia’s failure is not so much having chosen the wrong alternative to Symbian, but having chosen exclusively.
However, there’s a twist. The company did not accept exclusivity of one supplier without a concession: In exchange for exclusivity, Nokia negotiated $250 million every quarter in the form of “platform support payments” from Microsoft. Nokia has to date received over $1 billion in such payments. (For the last quarter that amounts to $86 for each Lumia phone shipped.)
The tragedy comes from this $1 billion/yr not being enough. The foregone revenues from Symbian (assuming they had been able to maintain the decline to the level of 150 million units that they had originally forecast) would be about $9 billion. This means that had Nokia not knifed Symbian and had sold the shortfall units at an average price of $200 they would have received an additional $9 billion in sales. Furthermore, assuming a margin of 33% for those units, Nokia received from Microsoft one third from of what she gave up for exclusivity.
In other words, the net cost of the Microsoft exclusive relationship is at least $2 billion in operating profit.
This turns out to be the difference between being profitable and being distressed.
We will never know if this scenario would have ever happened, but the forecast management made 21 months ago suggests that at least they thought this was what they were going to get out of the bargain.
This reminds me of another article posted around the same time.