Pages

Live blogging Feed

Tuesday, April 16, 2013

Escaping PCs

Escaping PCs:
The Windows PC market is contracting. The market data has been showing unit shipment declining for some time with the latest quarter having perhaps the steepest decline for two decades.
What remains undocumented however is how the market looks when considering economic value. A more complete picture would be to show revenues, average selling price (or revenue/unit), operating margins/unit and percent of profit capture.
The data is not beyond reach however. It involves combining the shipment estimates from e.g. Gartner with financial reports from the companies themselves. Some analysis is required to estimate margins but they are also not hard to obtain (e.g. from third parties.)
So here is a view of the market for the fourth quarter 2012:
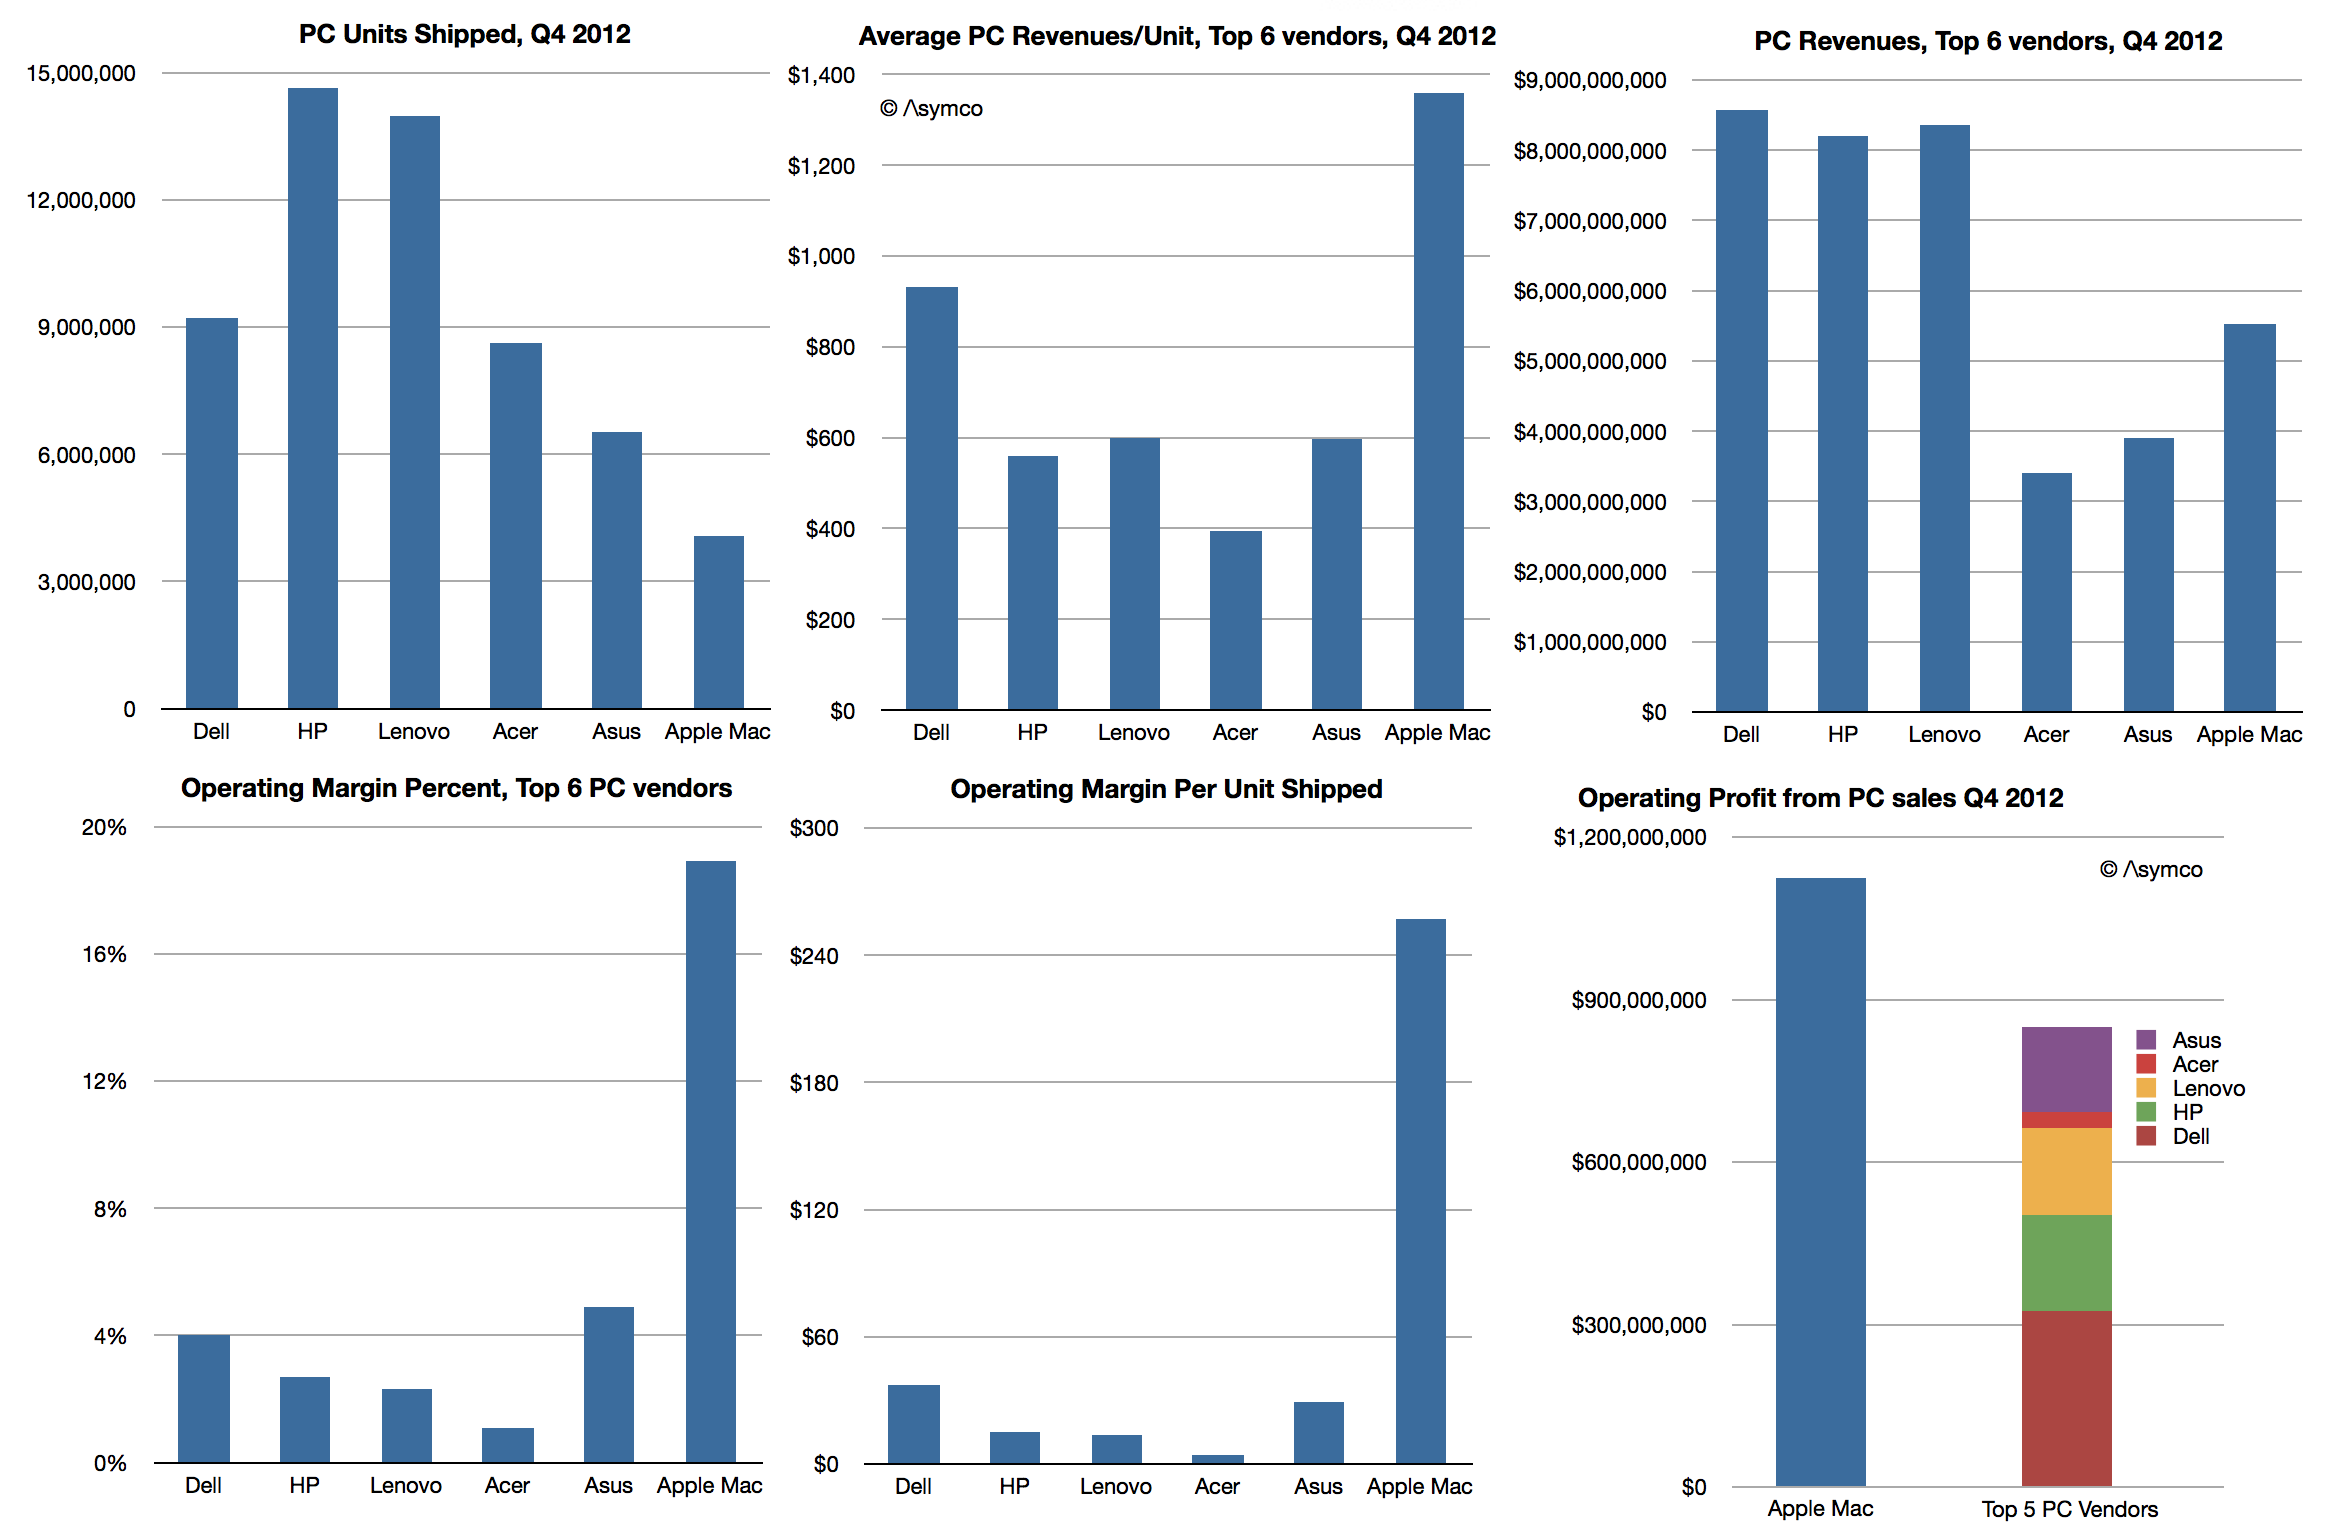
Screen Shot 2013-04-16 at 4-16-4.05.57 PM
The only inference I made was with respect to Apple’s margins for the Mac. These are based on deriving a gross margin of 26% and adding an estimate of the SG&A and R&D “overhead” of 7.1% of sales, a figure which applies to the entire company. This yield an operating margin of 18.9%.
If this estimate is considered then the operating profits from PC operations imply that Apple generates more profit than all the top 5 PC vendors combined.
Assuming further that “other” vendors have the same profitability ratio as the top 5 combined yields a figure of 45% “profit capture of PC market” for Apple. This is not as good as its performance in the phone market, where Apple has about 72%, but it’s not bad.
Screen Shot 2013-04-16 at 4-16-4.16.46 PM
The real problem for the PC vendors is not that they have such low margins–they’ve had low margins for decades. It’s that the volumes which “made up for” low margins are disappearing. Apple is not immune to a gradual erosion of Mac volumes, but they have positioned themselves for growth with devices and content commerce and services. They have essentially “escaped” PCs and indeed caused the need to escape in the first place.
The problem is what could the others do? It seems all they can do is depend on Microsoft getting their strategy right.
Sounds risky.

Flurry: Android and iOS users spend 32% of their app time playing games, 20% in the browser, 18% in Facebook

Flurry: Android and iOS users spend 32% of their app time playing games, 20% in the browser, 18% in Facebook: 709528 16822578 520x245 Flurry: Android and iOS users spend 32% of their app time playing games, 20% in the browser, 18% in Facebook
Android and iOS users in the US spend an average of 2 hours and 38 minutes every day using apps on smartphones and tablets. 20 percent of that time (or 31 minutes) is spent on the mobile Web using a browser, while 80 percent of that time (or 2 hours and 7 minutes) is spent inside other apps.
These latest figures come from mobile firm Flurry, which has helped “tens of thousands of developers” to integrate its analytics and ad platforms into their apps. The company regularly offers up interesting analysis in the mobile space thanks to the more than 300,000 apps it measures usage on, across more than 1 billion monthly active devices (smartphones and tablets).
Here are the latest results:
TimeSpent App vBrowserCats resized 600 Flurry: Android and iOS users spend 32% of their app time playing games, 20% in the browser, 18% in Facebook
As you can see, the games category is by far the highest at 32 percent. It even surpasses the browser app category, which has 20 percent broken down as follows: 12 percent in Safari, 4 percent in Android, and 2 percent in Opera mini. Interestingly, Chrome and Firefox still aren’t big enough to be broken out by themselves.
It’s not too surprising that Facebook has such a large share; we’ve gotten used to this fact, but it’s still impressive to see that mobile users spend almost as much time in the app as they do in their browser. Compare that to say, Twitter, which has some slice of the 6 percent social networking share you can see above, along with Pinterest and other similar apps.
A big reason for this, Flurry notes, is that a lot of people consume Web content from inside the Facebook app: they click on a friend’s link and view it inside Facebook’s web view rather than a native browser. In fact, Flurry makes a bold claim in its analysis: if we “consider the proportion of Facebook app usage that is within their web view (aka browser), then we can assert that Facebook has become the most adopted browser in terms of consumer time spent.”
This represents a huge opportunity for Facebook. Mind you, we already knew mobile is the key to the company’s growth, but positioning Facebook as a mobile browser that 680 million mobile users access every month, is a whole different ball game.
Flurry takes it further:
US consumers are spending almost 39 minutes per day on Facebook on average. Add to that their massive reach, their roughly billion mobile users per month and you have a sizable mobile black hole sucking up people’s time. The 30 minutes a day is a worldwide average and many people spend many more minutes on Facebook (if not hours) watching and participating in what has become the ultimate reality show in which the actors are you and your friends.
Yet at the end of the day, mobile users still love their games more than their browsers. Your best bet for building a popular app (read: one that people spend a lot of time using) is still to launch a killer game.
Top Image Credit: Alan Bridges

Monday, April 08, 2013

Flurry Five-Year Report: It’s an App World. The Web Just Lives in It

Flurry Five-Year Report: It’s an App World. The Web Just Lives in It:
Five years ago, the iPhone ushered in the era of mobile computing. Today, more than a billion consumers are “glued” to these devices and their applications, impacting nearly every aspect of their lives. For businesses, opportunities seem endless and disruption is everywhere. The list of disrupted industries is long, including communications, media and entertainment, logistics, education and healthcare, just to name a few.
The past five years at Flurry have been wildly exciting. We joined an industry just as gas was forming to ignite a Big Bang, and we’re still orienting ourselves within its rapidly expanding universe. Since early 2008, we’ve worked with tens of thousands of developers to integrate our analytics and ad platforms into their apps. Today our services have been added to more than 300,000 applications and we measure usage on more than 1 billion monthly active smart devices.
On the five-year anniversary of launching Flurry Analytics, we took some time to reflect on the industry and share some insights. First, we studied the time U.S. consumers spend between mobile apps and mobile browsers, as well as within mobile app categories. Let’s take a look.
TimeSpent App vBrowserCats resized 600
Today, the U.S. consumer spends an average of 2 hours and 38 minutes per day on smartphones and tablets. 80% of that time (2 hours and 7 minutes) is spent inside apps and 20% (31 minutes) is spent on the mobile web. Studying the chart shows that apps (and Facebook) are commanding a meaningful amount of consumers' time. All mobile browsers combined, which we now consider apps, control 20% of consumers' time. Gaming apps remain the largest category of all apps with 32% of time spent. Facebook is second with 18%, and Safari is 3rd with 12% Worth noting is that a lot of people are consuming web content from inside the Facebook app. For example, when a Facebook user clicks on a friend’s link or article, that content is shown inside its web view without launching a native web browser (e.g., Safari, Android or Chrome), which keeps the user in the app. So if we return to the chart and consider the proportion of Facebook app usage that is within their web view (aka browser), then we can assert that Facebook has become the most adopted browser in terms of consumer time spent.

The App World

Five years into its existence, the app economy is thriving, with The Wall Street Journal recently estimating annual revenue of $25 billion. Once again, we have to appreciate that this economy did not exist until 2008. As we looked for possible signs of slowing, we could not find any, largely due to the fast adoption of tablets just after smartphones.
In fact, not only is the installed base of devices growing, but also the number of apps consumers use.  Our next insight comes from studying how many apps the average consumer launches each day. For this snapshot, we compared three years of worldwide data, taking the 4th quarters of 2010, 2011 and 2012.
AppsLaunchedPerDay resized 600
From left to right, we see that the average number of apps launched per day by consumers climbs from 7.2 in 2010 to 7.5 in 2011 and finally to 7.9 in 2012. This is not a material change, which is a good thing. To us, the steady growth rate indicates that the app economy is not yet experiencing saturation, as consumers steadily use more apps over time. And while there are more apps in the store, large numbers of them have short lifespans, such as books, shows and games. Assertions that people are using fewer apps in 2012 than they did in 2010 appear to be incorrect. While one could observe that consumers use only 8 apps per day among the million+ available between the AppStore and Google Play, one also needs to remember that the 8 apps each consumer uses varies widely. This creates a marketplace that can support diversified apps.
Finally, we studied a sample of more than 2.2 million devices that have been active for more than 2 years to understand the mix of new versus existing apps people use over time. To do so, we compared Q4 2012 to Q4 2010.
New vSame AppUsage resized 600
The chart above shows that, on average, only 17% of the apps used in Q4 2010 were in use earlier in the year on a device compared to 37% in Q4 2012. That means that 63% of the apps used in Q4 2012 were new, and most likely not even developed in 2011 (or possibly poorly adopted). We believe that with consumers continuing to try so many new apps, the app market is still in early stages and there remains room for innovation as well as breakthrough new applications.

The Web World

Looking again at the first chart in this study, while also considering the latest numbers from IDC, which projects that tablets will outsell desktops this year and notebooks next year, we draw the conclusion that the web, as we know it, is already facing a serious challenge. Does this mean the web is dead? We don’t believe so. On the contrary, we believe that the web will change and adapt to the reality of smartphones and tablets. Websites will look and behave more like apps. Websites will be optimized for user experience first and search engine optimization second. This supports the trend of mobile first and web second, which brings both mobile app and user experience design to the mobile web. Simply compare Target’s app on iPhone to its mobile web site (target.com) accessed from the iPhone. The mobile web site looks and behaves similarly to the Target app, albeit a little bit slower.

… and Facebook

Continuing to think about the first chart, it appears that mobile, once perceived as Facebook’s Achilles' heel, has become Facebook’s biggest opportunity. Consumers are spending an average of nearly 30 minutes per day on Facebook. Add to that Facebook's massive reach, as well as their roughly billion mobile users per month and you have a sizable mobile black hole sucking up peoples' time. The 30 minutes a day is a worldwide average which means a large group spends even more time on Facebook (possibly hours) watching and participating in what has become the ultimate reality show in which the actors are you and your friends.
The disruptive force of the mobile app economy has created opportunities, rising stars, instant millionaires, dinosaurs and plenty of confusion. However, one undeniable truth is that tablets and smartphones are eating up desktops, and notebooks and apps (including the Facebook app) are eating up the web and peoples’ time. 


The cost of building Galaxies (and iPhones)

The cost of building Galaxies (and iPhones):
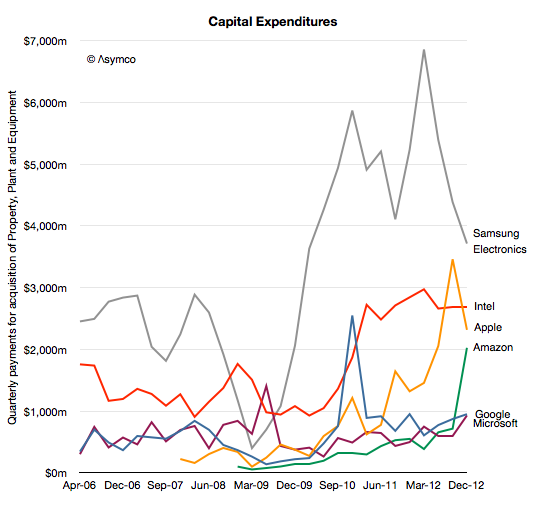
Although Samsung and Apple are acclaimed as the leaders in profit capture for smart (and otherwise) phones, what is not lauded is how much they spend on capital equipment used in the making of these phones.
In 2012 Samsung spent around $20 billion while Apple spent about $10 billion (excluding leasehold improvements or Apple stores but including real estate).
Compare these figures with Intel at $11 billion, Google at $3.2 billion, Microsoft about $2.8 billion and Amazon $3.8 billion (including presumably new distribution centers.)
Screen Shot 2013-04-04 at 4-4-5.51.15 PM
What each company spends on differs depending on its business model, but as the graph above shows it’s easy to see that there is a class of “big spenders” who spend so much that it makes it hard to imagine just what $10 billion/yr could actually buy.
To get an idea of just how big that figure is consider that a Nimitz class aircraft carrier costs about $4.5 billion to build and it takes several years to do it. Or consider that the largest data center in the world probably costs about $1 billion or that the largest office building will cost between $4 and $5 billion. Either of these infrastructure projects are massive multi-year projects. Apple, Intel and Samsung spend well more than this every six months.
So it’s a special class of equipment which falls in the multi-billion dollar range: semiconductor process equipment.
Whereas in the case of Intel it’s the obvious target for the funds, how can we assume it’s the case for Apple and Samsung.
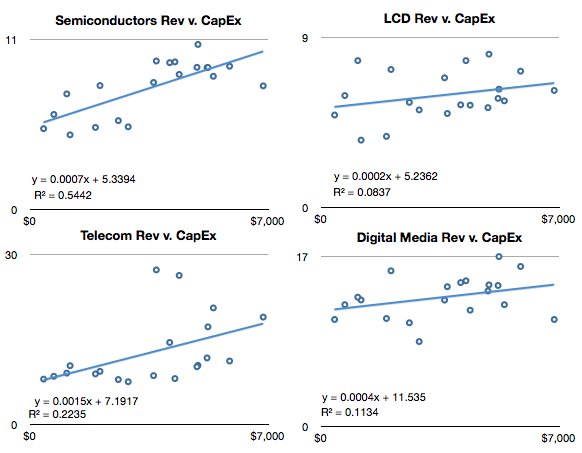
We don’t have proof but there is a remarkable correlation between CapEx and Semiconductors in Samsung’s divisional financial reports:
Screen Shot 2013-04-04 at 4-4-5.58.22 PM
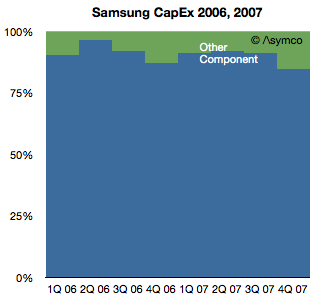
We also have the historically reported allocation of CapEx as reported prior to 2008:
Screen Shot 2013-04-04 at 4-4-6.00.26 PM

Therefore I consider it safe to assume that the bulk of Samsung’s Capital Expenditures are in support of semiconductor production (note that this does not include display panels).
Note however that in the first graph, Samsung’s expenditures seem to be declining. Measured in Won, the level in Q4 ’12 was about the same as that in Q1 2010 and down 30% y/y. Apple’s spending also dropped sequentially in Q4 but was up 75% y/y. It’s also nearly ten times higher than what Apple spent in Q1 2010.
So the question I would ask is whether Samsung’s reduction CapEx (which is safely assumed to be supporting semiconductor production, and which, in turn, is, to a large degree, supporting Apple) is being picked up by Apple.
If so then then this would be evidence of the re-alignment of role and control in the value chain of a terribly important industry.

Android Version History: A Visual Timeline

Reasons for iOS outperformance in the US

Reasons for iOS outperformance in the US:
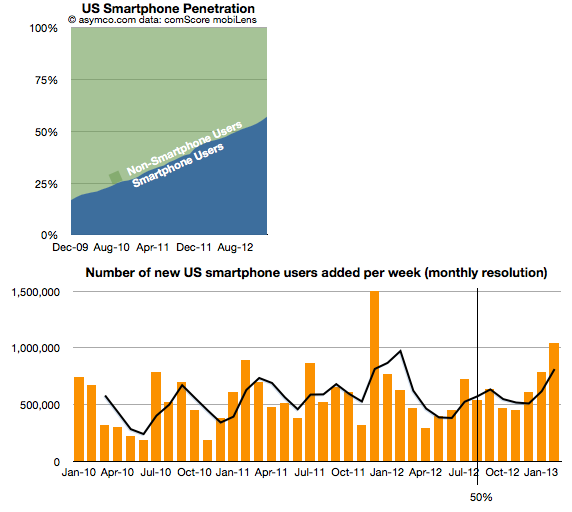
The comScore mobiLens survey for the US ending February 2013 shows continuing rapid expansion of smartphone usage in the US. Even though the 50% penetration threshold was passed seven months earlier, the rate of new smartphone users was second highest ever recorded with over 1 million new-to-smartphones users every week during February.
Screen Shot 2013-04-05 at 4-5-4.15.52 PM
Overall penetration increased to 57% with nearly 2% of the population switching in one month. Using the average growth rate for the last six periods, the US could see 80% penetration in another 19 months or by Q3/Q4 2014.
It remains to be seen if the consistency of growth which was preserved from 20% to 60% is maintained between 60% and 80%, but all indications so far are that it will be.
The growth in smartphones has been driven by the two dominant platforms: iPhone (iOS) and Android. Together they now make up 91% of the user base with about 40% for iPhone and 51% for Android.
Screen Shot 2013-04-05 at 4-5-4.19.14 PM
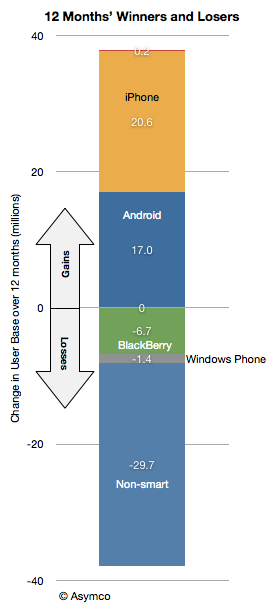
Android alone gained 17 million users in the last 12 months while iPhone gained 21 million users.
Screen Shot 2013-04-05 at 4-5-4.20.02 PM
iOS user gains have out-paced Android for the last four periods which resulted in a decrease in Android share of users. A reduction in Android share was also visible in the spring of last year but the current decline is not only longer but more pronounced.
Screen Shot 2013-04-05 at 4-5-4.22.13 PM
The reason iOS is growing more rapidly may be due to three factors:
  1. Broader distribution with three out of four major operators carrying the phone
  2. Availability of three product variants with $0 starting prices.
  3. Increasing awareness and use of apps and content ecosystems due to network effects.
As distribution is about to increase with T-Mobile being added to the carrier list the growth in iOS share is likely to continue even as the market expands.

Monday, March 11, 2013

Where are the Android users?

Where are the Android users?:
Google occasionally reports data regarding Android. Very occasionally. The last time we had some data was in September 2012 when we learned that activations were running at 1.3 million per day and that a total of 500 million total activations had taken place.
As of today, being March 2013, the time between updates has reached five months. It’s the longest gap so far. Benedict Evans also notes that it’s been five months since the data regarding screen size stats has been updated on the Android developer site.
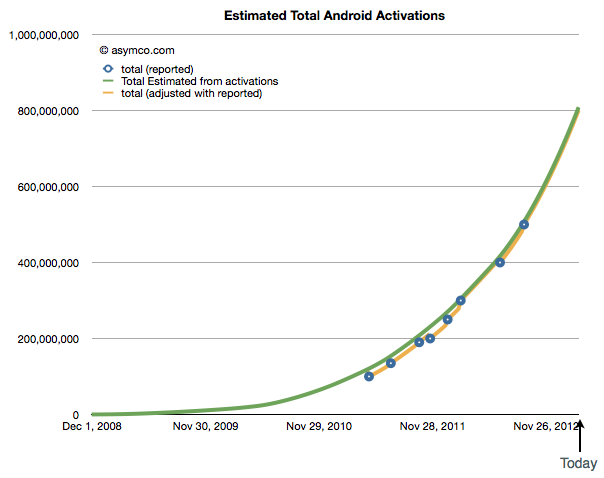
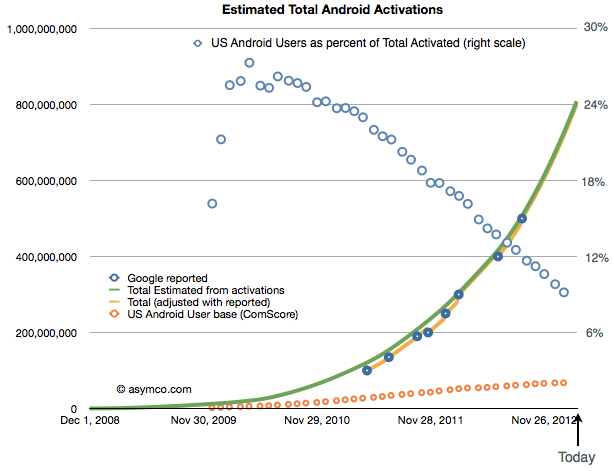
But we have to live with what we get and, in the absence of an update, the pattern of growth in Android, if sustained, looks like this:
Screen Shot 2013-03-10 at 3-10-11.05.14 PM
It implies that 800 million Android activations have taken place to date and the rate is about 2 million per day. One billion activations could thus happen by June.
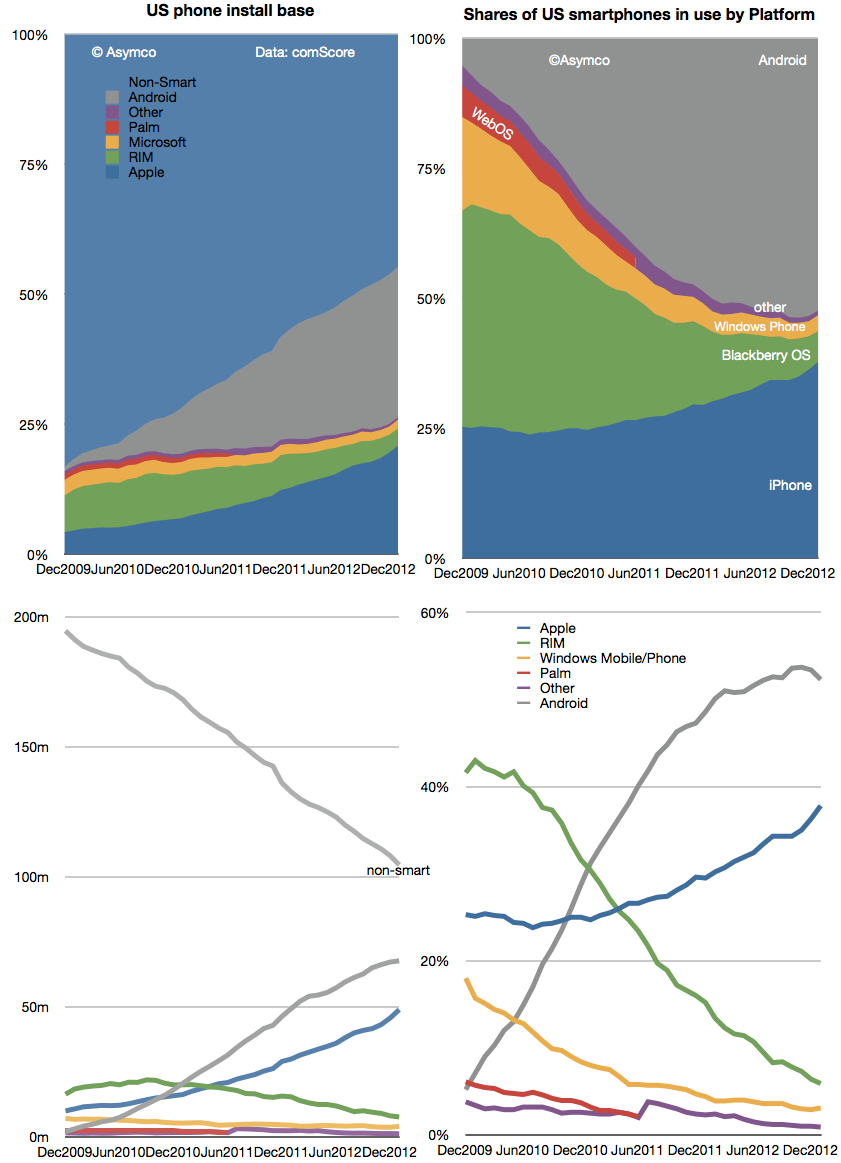
There is however another set of data regarding Android which is updated more frequently. The comScore mobiLens survey covers the US and provides updates on a monthly basis. That data shows that Android users in the US reached about 68 million as of the end of January. See the updated data below:
Screen Shot 2013-03-11 at 3-11-10.26.01 AM
I included the install base and share of total users as reported. Combining the comScore data with Google’s activations gives the following picture of US as a percent of global Android (orange circles represent US base and blue circles the precent of total activations that the US might represent)[1].
Screen Shot 2013-03-10 at 3-10-11.44.34 PM
The data implies about 9% of Android usage is in the US. The more startling thing is the difference in growth: it implies that with a US growth rate of only about 13.3k/day, global growth is 150 times faster than US growth. In other words, that 0.6% of new users are in the US and that 99.4% of Android growth is outside the US.
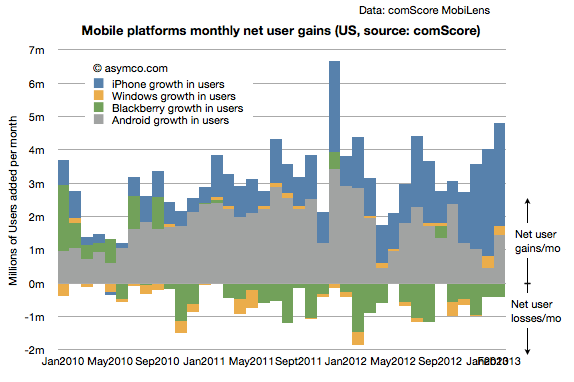
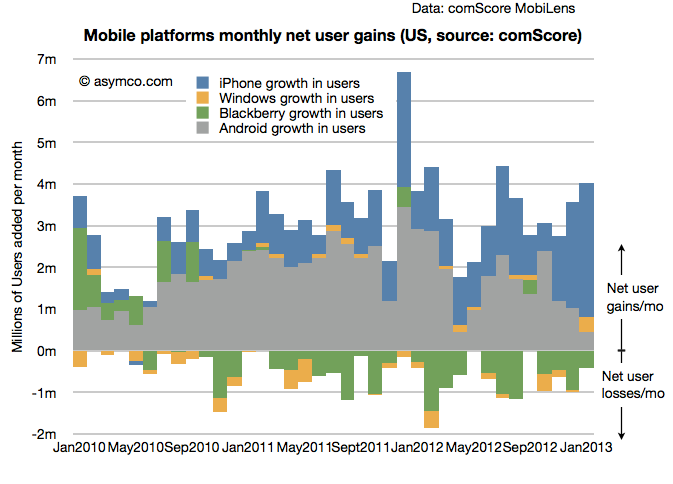
That’s an interesting story. But it’s even more interesting that this is not the case with the iPhone. The iPhone is growing considerably faster in the US than Android. One can see this more easily with a graph of the US mobile platform net user gain rate as shown below:
Screen Shot 2013-03-11 at 3-11-10.32.23 AM

Looking at the the same contrast between global and US, from Apple’s financial reports, in the fourth quarter the global “activation rate” (i.e. sales rate) for iPhone was 525k/day (nearly one quarter of the extrapolated Android rate). The comScore data suggests the US gains are running at 106k/day. Therefore we can calculate that about 20% of iPhone growth is in the US and 80% is outside the US.
Even accounting for some potential error in the Android estimates, the contrast is quite stunning: 1% vs. 20% share of growth suggests something is very different about the US with respect to the two platforms.
My suspicion is that it has something to do with the fact that the US is one of the few (but largest) market where the iPhone is available as a “low end” offering. At a minimum price of $0 (with a contract) many consumers are finding the iPhone attractive relative to a $0 (with a contract) Android phone. This price parity (illusory as it may be) allows iPhone to grow even faster than Android in this particular market.
One wonders what would happen if such price parity were present globally.
—
Notes:
  1. Android activation data as reported by Google includes tablets but excludes many unofficial Android builds e.g. Amazon Kindle and many Chinese phones and tablets that don’t register with Google services. comScore data includes only primary devices used by consumers and excludes corporate purchases and devices whose primary users are younger than 13 years.

Thursday, February 28, 2013

Exactly how ginormous is Android?

Exactly how ginormous is Android?:
android logoThere is no denying that Android, Google’s operating system for mobile devices, is big. For example, Android is the OS on 42% of all consumer compute devices.
We have scoured the web for data that will help us show exactly how big Android is in the smartphone world. And in every way we looked at it, Android is ginormous.

Smartphone web traffic

In terms of smartphone web traffic, Android leads the way, but perhaps not in the same crushing way as in other areas.
Web traffic is interesting, because it gives us an indication of the actual use of smartphones. Looking at the past four years, Android is the only mobile OS that has been constantly growing in use. Currently, Android’s share of smartphone web traffic stands at 37%.
smartphone web traffic by os
For the last year, it looks as this is going to be a two-horse race between Android and iOS. All the other mobile operation systems seem do be doomed to a slow death, getting used less and less.

Market shares in the top 5 Android and iOS markets

In terms of sales, the two biggest markets for Android and iOS devices are China and the USA. The leading OS in both these markets is Android. In fact, the same is true for all five top Android and iOS markets.
Market share top 5
Android’s progress in China does not get any less impressive when you consider that China recently passed the USA as the biggest market for Android and iOS devices.

Android outpaces growing smartphone market

In just a year, from Q4 2011 to Q4 2012, the worldwide smartphone market grew by almost 40%. However, Android in the same time period, grew by an amazing 88%.
smartphone shipment q4
Here are some other numbers worth noting:
  • For Q4 2012, the worldwide market for smartphones was 208 million devices.
  • Out of this, Android’s share was 144.7 million smartphones and iOS accounted for 43.5 million smartphones.
  • Shipments of iOS smartphones increased by about 23%.
  • For all other mobile operating systems, it looks bleak. Their combined share is down from 25% to 10%.

Largest smartphone manufacturer; it’s an Android brand

While there is only one manufacturer that uses iOS, there are several that use Android as the OS on their mobile devices. So even though there are more Android smartphones that ship, the biggest manufacturer could still be Apple. But it´s not, not even close.
largest smartphone manufacturers
Yes, it is true that Samsung also makes smartphones with other operating systems than Android. But according to recent numbers, 94% of all Samsung smartphones run on Android. That means 214 million units, still way ahead of Apple.

It’s an Android world

So far, everything has shown that Android rules the smartphone OS world. This doesn’t change if you look at the market share worldwide for smartphones. With a 65% market share of worldwide smartphone sales at the end of last year, Android dwarfs the 20% share that iOS had.
market share mobil os
It will be very interesting to see these numbers at the end of 2013. Surely this growth can’t continue, or can it?

Android is up everywhere you look

Nothing in our data, and we mean nothing, indicates that Android is going to start losing ground in the smartphone market. Actually, everything points in the other direction, it is up everywhere you look.
What will be interesting to see during 2013 is what will happen to Windows Phone and BlackBerry. Will they at least make the smartphone market a bit more interesting, and not just a big Android show with the iOS sidekick?

This was a post from the guys at Pingdom, a site monitoring service that makes sure you're the first to know when your site is down. Check it out for free.

Internet Explorer continues growth past 55% market share thanks to IE9 and IE10, as Chrome hits 17-month low

Internet Explorer continues growth past 55% market share thanks to IE9 and IE10, as Chrome hits 17-month low: 358898 1321 520x245 Internet Explorer continues growth past 55% market share thanks to IE9 and IE10, as Chrome hits 17 month low
Last month we said 2013 wouldn’t disappoint in the battle of the top three browsers, and boy were we right. February was the fourth full month of IE10 availability as well as when new versions of competing browsers launched in the same week: Firefox 19 and Chrome 25. The latest market share numbers from Net Applications show that Chrome is so far still the only loser in 2013.
Between January and February, Internet Explorer gained 0.68 percentage points (from 55.14 percent to 55.82 percent) and Firefox was up 0.18 percentage points (from 19.94 percent to 20.12 percent). Chrome meanwhile fell a huge 1.21 percentage points (from 17.48 percent to 16.27 percent). Safari was up 0.18 percentage points to 5.42 percent and Opera picked up 0.10 percentage points to grab 0.55 percent.
ie february 2013 730x524 Internet Explorer continues growth past 55% market share thanks to IE9 and IE10, as Chrome hits 17 month low
At 55.82 percent, Internet Explorer is still growing. January was the first time the browser went back above the 55 mark in a long time, and February showed it won’t be losing that crown just yet. Despite Windows 8′s release and gains, however, IE10 continues to have a hard time pushing things forward.
At 1.58 percent in January, the browser gained just 0.29 percentage points last month while IE9 recovered after its first loss in January, propelling to 21.67 percent (down by 0.74 percent percentage points). There is some good news for IE10 though, it’s available for Windows 7 now, so we should see some accelerated growth in the coming months.
IE8 lost 0.16 percentage points, but it’s still the world’s most popular browser at 23.38 percent. IE7 was down 0.12 percentage points and IE6 fell a nice 0.36 percentage points. Everyone can’t wait for it to fall below the 5 percent mark, but that won’t happen till sometime later this year (and China is delaying things).
firefox february 2013 730x519 Internet Explorer continues growth past 55% market share thanks to IE9 and IE10, as Chrome hits 17 month low
At 20.12 percent, Firefox continues to hover at the one-fifth-of-the-market mark. Firefox 19 managed to grab 3.32 percentage points, which naturally would have been higher if the browser was available for a full month. Firefox 18 grabbed 2.77 percentage points, while all the older versions lost share: Firefox 17 fell 5.00 percentage points, Firefox 16 was down 0.26 percentage points, and Firefox 15 lost 0.07 percentage points.
chrome february 2013 730x533 Internet Explorer continues growth past 55% market share thanks to IE9 and IE10, as Chrome hits 17 month low
At 16.27 percent, Chrome took a serious beating in February. We haven’t seen the browser at the 16 percent mark since September 2011. Late last year, it saw three months of losses in a row, and now it’s two for three again after its losses in January. Nevertheless, Chrome 25 grabbed 3.14 percentage points, while Chrome 24 grabbed 2.18 percentage points. Chrome 23 was down 6.13 percentage points and Chrome 22 fell 0.12 percentage points.
As we already mentioned, new versions of Firefox and Chrome were released two days apart this month. Thanks to Mozilla’s and Google’s automatic updating systems, the majority of their respective users will be on Firefox 19 and Chrome 25 by the end of March.
While we’ve been waiting for Chrome to pass Firefox for a while now, it’s becoming less and less likely. February seems to be just a blip, though this is just speculation right now. IE9 will soon pass IE8, taking the crown as the world’s most popular browser version, and hopefully IE10 will pass IE7 and IE6.
Net Applications uses data captured from 160 million unique visitors each month. The service monitors some 40,000 Web sites for its clients. StatCounter is another popular service for watching market share moves; the company looks at 15 billion page views. To us, it makes more sense to keep track of users than page views.
Nevertheless, for Februar 2013, StatCounter listed Chrome as first with 37.09 percent market share, IE in second with 29.82 percent, Firefox in third with 21.34 percent, Safari with 8.60 percent, and Opera with 1.22 percent. The only part everyone agrees on is that Safari and Opera are not in the top three.
See also – Windows 8 now up to 2.79% market share as Windows 7 stabilizes after its first decline
Image credit: Hugo Humberto Plácido da Silva

Thursday, February 21, 2013

comScore: Apple increases lead as top US smartphone maker while Samsung gains; Android and iOS fortify duopoly

comScore: Apple increases lead as top US smartphone maker while Samsung gains; Android and iOS fortify duopoly: 150815100 520x245 comScore: Apple increases lead as top US smartphone maker while Samsung gains; Android and iOS fortify duopoly
Apple may not be king when it comes to smartphones around the world, but at home it ended 2012 as the top OEM. In the US, Apple is increasing its share in first place and Samsung is slowly gaining on it in second. Rounding out the top five are HTC, Motorola, and LG.
The story is similar in the platform space, although slightly reversed: Google is first courtesy of Android, Apple is second with iOS, but the latter is gaining on the former. Again, rounding out the top five are BlackBerry, Microsoft, and Symbian.
The latest data comes from comScore, which as usual surveyed over 30,000 mobile subscribers in the US (although it limited its results to smartphones this time, for some reason). The analytics firm says 125.9 Americans owned smartphones (54 percent mobile market penetration) in December, up 5 percent since September.
Between those two months, here is how the top five smartphones OEMs have fared:
comscore os december comScore: Apple increases lead as top US smartphone maker while Samsung gains; Android and iOS fortify duopoly
As you can see, Apple gained 2.0 percentage points in terms of smartphone subscribers (from 34.3 percent to 36.3 percent) while Samsung jumped 2.3 percentage points (from 18.7 percent to 21.0 percent). HTC fell 1.8 percentage points (from 12.0 percent to 10.2 percent), Motorola dropped 0.7 percentage points (from 9.8 percent to 9.1 percent), and LG managed to gain 0.7 percentage points (from 6.6 percent to 7.1 percent).
Samsung and Apple gained a combined 4.3 percentage points while the other three lost 2.0 percentage points together. In other words, the duo is even stealing share from OEMs not in the top five.
It appears that the iPhone 5 is helping keep Apple ahead, but Samsung isn’t really affected. Meanwhile, we can attribute LG’s gains to Google marketing the Nexus 4, although sales have been limited by supply issues.
Meanwhile, on the software side, Google is dominating and Apple is moving ahead in second place. Everyone else is losing share or has already become irrelevant (take your pick):
comscore devices december1 comScore: Apple increases lead as top US smartphone maker while Samsung gains; Android and iOS fortify duopoly
Samsung may be slowly gaining on Apple in the smartphone space, but iOS is growing faster overall when compared to Android, at least in this snapshot. Google gained 0.9 percentage points between September and December (up from 52.5 percent to 53.4 percent) to further pull ahead in first place. Apple increased its share by 2.0 percentage points (moving from 34.3 percent to 36.3 percent).
Meanwhile, BlackBerry is down 2.0 percentage points (from 8.4 percent to 6.4 percent), Microsoft lost 0.7 percentage points (from 3.6 percent to 2.9 percent), and Symbian seems to have stagnated at 0.6 percent. Naturally, we’ll be looking closely to see if BlackBerry can recover in the coming months with its BlackBerry 10 launch, though it will be very difficult as the company continues to be the biggest loser in these studies, month after month.
Again looking at the winners and losers, Google and Apple gained a combined 2.9 percentage points, while the other three lost 2.7 percent. The duopoly is even stealing from other smartphone OS makers as Americans seem to be perfectly happy to choose between the two camps.
Image credit: Jung Yeon-Je/Getty Images

China to hit 246m Android and iOS devices this month, taking it past the US to become world’s largest market

China to hit 246m Android and iOS devices this month, taking it past the US to become world’s largest market: 756206 30290725 520x245 China to hit 246m Android and iOS devices this month, taking it past the US to become worlds largest market
This month, China is slated to pass the US to become the world’s top country for active Android and iOS smartphones and tablets. In January 2013, China and the US had roughly the same active device installed base: 221 million and 222 million, respectively. By the end of February 2013, China will have an estimated 246 million devices compared to 230 million in the US.
The findings come from Flurry, which tracks over 2.4 billion anonymous app sessions per day across more than 275,000 apps around the world, and says it can reliably measure activity across more than 90 percent of the world’s smartphones and tablets. Based on historical growth trends as well as the number of detected devices per country through the first of this month, the company estimated its numbers for the end of this month.
Here’s the historic data with the projection in graph form:
SmartDevice InstalledBase China vs US Feb2013 resized 600 China to hit 246m Android and iOS devices this month, taking it past the US to become worlds largest market
If China really does claim gold from the US in February, it will be exactly 12 months since Flurry reported that the country had become the world’s fastest growing market for smartphones and tablets. The company unsurprisingly doesn’t expect the US to take back the lead from China, citing the countries’ populations: just over 310 million versus over 1.3 billion, respectively.
The only country that could feasibly take that spot is India, which has a population of just over 1.2 billion. Yet it is currently in 10th place with 19 million smartphones and tablets, according to Flurry:
SmartDevice InstalledBase Jan2013 resized 600 China to hit 246m Android and iOS devices this month, taking it past the US to become worlds largest market
Interestingly, both the US and China have more than five times the active installed base than that of the UK, the world’s third largest market. Furthermore, both countries continue to see rapid device adoption.
China may no longer lead the world in growth, but it still commanded an impressive 209 percent rate on top of a base of 71 million devices from January 2012. The below chart excludes countries with less than half a million devices as of January 2012:
SmartDevice GrowthRates Jan2013 resized 600 China to hit 246m Android and iOS devices this month, taking it past the US to become worlds largest market
Only Columbia, Vietnam, Turkey, Ukraine, and Egypt grew faster than China. Year-over-year, compared to January 2012, the US added 55 million new devices, while China added 150 million new devices. Flurry says China would have passed the US earlier, given its growth rate, but the American holiday season delayed the inevitable for an additional two months.
See also – Duopoly: 98% of Q4 smartphone shipments in China were powered by Android or iOS, at 86% and 12% respectively and Despite the iPhone’s monumental Q4, Android still powered 50% of all smartphones sold
Image credit: Gary Tamin

Thursday, January 31, 2013

Survey Report: Android And iOS Most Popular Development Platforms, But Developers Looking For Alternatives

Survey Report: Android And iOS Most Popular Development Platforms, But Developers Looking For Alternatives:
Market strategy firm Vision Mobile just released their fourth annual survey report “Developer Economics 2013″. For the report, subtitled “Developer Tools: Foundations of the App Economy”. 3,460 developers across 95 countries were surveyed. The report contains interesting insights into developer mindshare, revenue and lead platforms. This report specifically, also focuses on developer tools, incl. ad-networks, back-end as a service, cross-platfrom tools, cross-promotion networks, user analytics, and voice services.
The full report is available free of charge here.
We would like to highlight a few of the findings regarding app distribution in the app stores.
Android continues to lead mobile developer mindshare, with 72% of developers now developing for the platform, a 4 percentage point increase compared to our 2012 survey. iOS shows a 5 percentage point drop, to 56%, in Mindshare, which we attribute mostly to the influx of Asian developers showing a clear preference towards Android. The considerable share of mobile developers intending to adopt Windows Phone (47%) and BB10 (15%) indicate that there is still developer interest in a viable third app ecosystem.

The report also gave some insights into the effect on revenue of developing for multiple platforms. 74% of developers use two or more platforms concurrently. On average mobile developers use 2.6 mobile platforms in our latest research, compared to 2.7 in 2012 and 3.2 in our 2011 research. The Android-iOS duopoly in smartphone sales is gradually creating a concentration of developers around these two platforms: 80% of respondents in our sample develop for Android, iOS or both, making them the baseline in any platform mix. Developers that do not develop for one of these two platforms generate, on average, half the revenue of those developers that do, leaving little doubt as to the concentration of power within these two major ecosystems.
  For more results from the survey, you can download the full report here.

Tuesday, January 29, 2013

Report: Amazon dominates Android tablets, US-based Kindle Fires alone are 33% of global devices

Report: Amazon dominates Android tablets, US-based Kindle Fires alone are 33% of global devices: kindle fire dominance 520x245 Report: Amazon dominates Android tablets, US based Kindle Fires alone are 33% of global devices
Google entered the tablet market with its Nexus 7 range last year but it is Amazon, the US retailer that has a somewhat strained relationship with the search giant, that is dominating the Android tablet market worldwide with its Kindle Fire range, a new report claims.
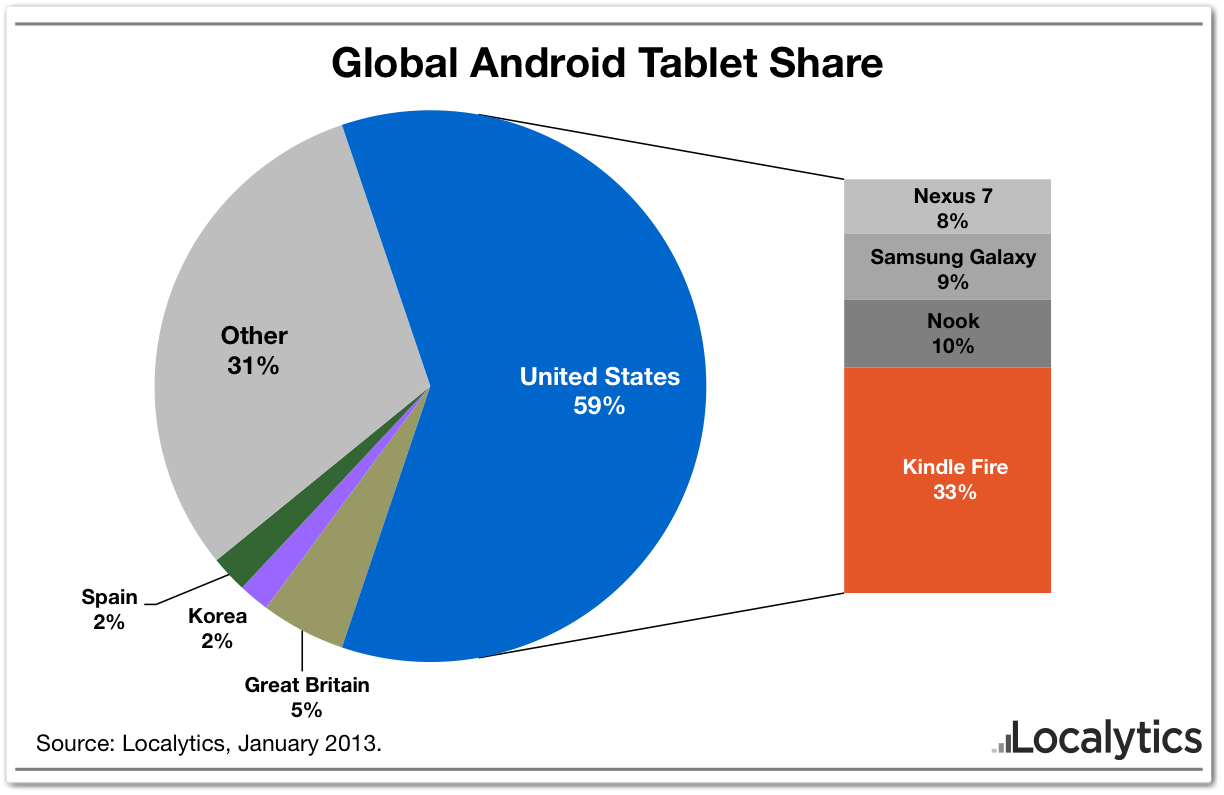
Research from mobile app analytics service Localytics which goes live tomorrow shows that the Kindle Fire is by far and away the most owned Android tablet on the planet. The company estimates that the number of Amazon Fire devices in the US alone represents 33 percent of all Android tablets worldwide — while the US itself is the world’s biggest tablet market with a 59 percent market share.
There is a key reason behind that factor, namely the limited availability of the Kindle Fire range itself. Initially available in the US only, Amazon later released its devices in selected European markets but Localytics estimates that 89 percent of Kindle Fires are based in the US.
Localytics doesn’t break out device metrics for other tablets but, with US based Kindle devices according for a third of all Android tablets worldwide, it is well ahead of the Nexus 7 (US ownership is 8 percent of the worldwide total), Samsung’s Galaxy range (9 percent) and Barnes and Noble’s Nook (10 percent).
global android tablet share 730x474 Report: Amazon dominates Android tablets, US based Kindle Fires alone are 33% of global devices
Of course, it goes without saying that these are estimates (notably devoid of raw sales or shipments figures) but they present an interesting snapshot of the Android tablet market as it stands today. Localytics says it has “insights into over 500 million unique devices” which have run its analytics and in-app marketing solution.
Apple’s iPad has long defined the industry, there’s no doubt in that, but it stands to reason that the broad range of Android partners and devices that they produce will, at some point, eat into Apple’s dominance of the market — as has happened with global smartphone numbers. Likewise, the growing maturity of Google’s Nexus 7 tablets are likely to challenge Amazon. Though initial supply has been limited, consumer demand has been buoyant…though Google lacks the range of devices, width of price points and market maturity of the Kindle Fire.
Over time one might expect adoption of Android tablets to grow out of the US, and likewise Amazon’s share of the Android tablet eco-system to lessen as devices from others grow their footprint overseas. However, running counter to that, Amazon is focusing on taking its success global but internationalizing the Kindle. Given that it makes a loss on the sale of devices — content is its real money earner — it has the potential to use aggressive pricing strategies to draw in new and existing tablet owners across the world like few other players can.
Indeed, it could be hugely disruptive in China when it finally launches there. Amazon’s app store has already gone live in the country, so it seems like it is only a matter of time before the Kindle, Kindle Fire and others arrive.
As it stands today, aside from the US and UK, Localytics says that “no other country has even one percent of worldwide Kindle Fires”. We know that tablet option is at its highest in Western markets, that can be seen as a huge opportunity for growth, or potential for the competition.
Enders Analysis analyst Benedict Evans recently looked at what Google stands to gain from Android. While much of the motivation is to help technology reach the hands of new users, Google’s services are baked into the operating system. As it stands, given that Amazon’s own fork of Android cuts out a number of key Google properties — most notable the Google Play app and content store — its continued dominance is lessening the impact of said Google services in Android.
Overall, the takeaway for Android developers is clear, ignore the Kindle at your peril, as Localytics explains:
In the meantime, any Android developer with a focus on tablets should be distributing their apps in the Amazon App Store. The degree to which Amazon has dominated their most serious geographical market should speak to the future potential, and since Google Play is unavailable on the Kindle Fire family, adding Amazon’s App Store as a distribution channel is important.
Headline image via by who_da_fly / Flickr